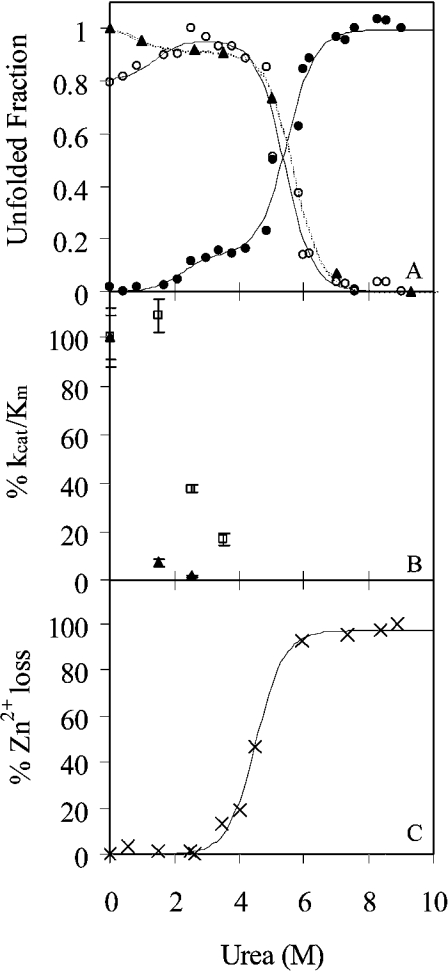
Figure 3. Effect of urea on the structure and stability of TOP.
(A) Unfolding of TOP monitored by intrinsic fluorescence of tryptophan at 326 nm (○) and 377 nm (●) upon excitation at 295 nm and fluorescence anisotropy (▲). All data were normalized to the maximum intensity. Lines represent the fit of the data to double sigmoidal equations (1) and (2) in the Experimental section. (B) The effect of urea on the activity of TOP. The kinetic parameter kcat/Km for MCA (▲) and mca-Bk (□), normalized to 100% activity at 0 M urea, is plotted as a function of increasing urea concentration. (C) Zn(II) loss from the enzyme as a function of urea monitored by the change in absorption of PAR upon binding Zn. The data were normalized to the percentage of Zn(II) lost at minimum and maximum absorption of PAR at 500 nm.

