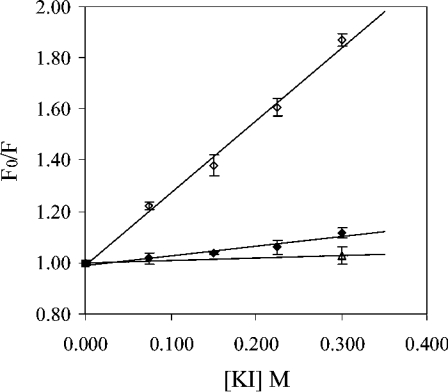
Figure 4. Stern–Volmer plots for the quenching (λexcitation, 295 nm) of tryptophan emission by I− at 0 M urea (△), 3.5 M urea (◆) and 7.0 M urea (◇).
These concentrations of urea represent the three plateau regions represented by the change in emission at 377 nm shown in Figure 2(A).

