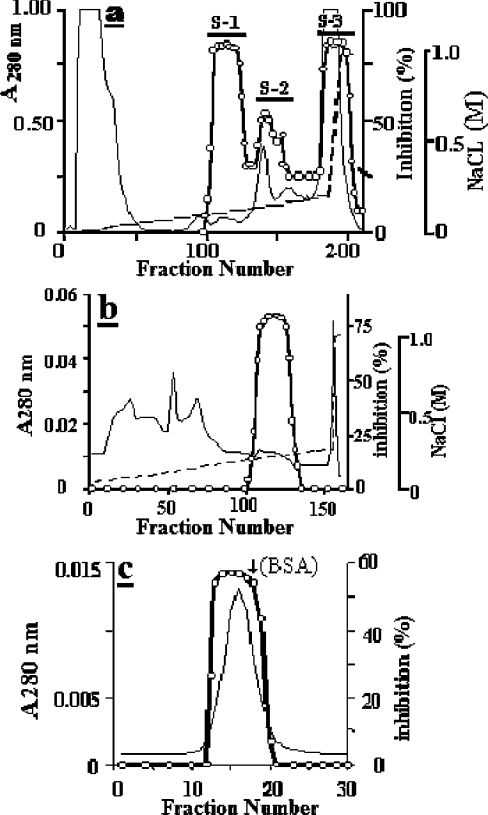
Figure 1. Major chromatography steps used for the purification of mEndopin 1.
(a) Elution profile of the muscle crude extract at pH 4.5 from a SP-Sepharose column (5 cm×10 cm). Only the S-1 trypsin inhibitory peak will be subsequently considered. (b) Elution profile of the S-1 from a Q-Sepharose column (2.5 cm×10 cm) at pH 8.0. (c) Gel filtration profile of the Fractogel EMD-DEAE-650 pooled active fractions run on a Superose 12 HR 10/10 column at pH 8.0. The protein peak was eluted just before BSA (arrow). Calibration of the gel filtration column was performed using ferritin (440 kDa), catalase (232 kDa), aldolase (150 kDa), BSA (67 kDa), β-lactoglobulin (35 kDa) and α-lactalbumin (14 kDa). In all profiles, the continuous line is the absorbance at 280 nm, the broken line corresponds to the NaCl gradient and open circles indicate the trypsin inhibitory activity.

