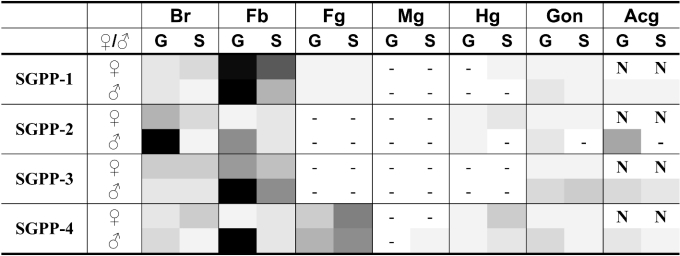
Figure 6. Overview of SGPP-1–4 transcript levels in different tissues from isolated- and crowded-reared desert locusts.
SGPP-1–4 transcript levels (data for SGPP-1–3 transcripts from [28]; for SGPP-4, see Figure 3) were measured in different tissues, i.e. brain (Br), fat body (Fb), foregut (Fg), midgut (Mg), hindgut (Hg), gonads (G) and male accessory glands (Acg) from isolated-reared (S) and crowded-reared (G) desert locusts. No data are available on female accessory glands (N). Then, per SGPP transcript, the normalized transcript levels, corresponding to all the different experimental conditions, were expressed as a percentage of the maximal expression level (%MAX). In the schematic colour presentation, the grey-black colour intensity (>0% and ≤100%) corresponds to the %MAX: %MAX<0.5% are indicated as ‘−’, 0.5%≤%MAX≤5% are indicated by a grey tone of 5%, and so on. Thus the highest SGPP-4 transcript level, which is recorded in fat body from gregarious males (%MAX=100%) is represented in black, while the relative mRNA content in fat body from solitarious males (10≤%MAX≤15%) is represented by a 15%-grey tone.

