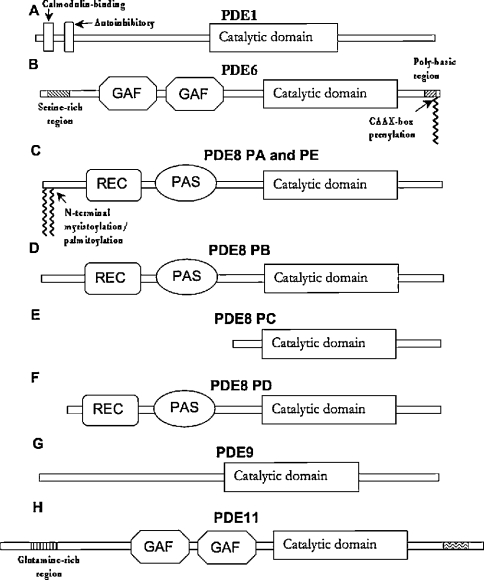
Figure 2. Schematic diagram of novel Drosophila PDEs.
Schematic representations of deduced protein sequences are derived from ClustalW alignments. These were made for each putative Drosophila PDE: (A) PDE1, (B) PDE6, (C–F) PDE8, (G) PDE9 and (H) PDE11 with their closest mammalian homologue, as ascertained by lowest BLAST expect score and closest overall sequence similarity.

