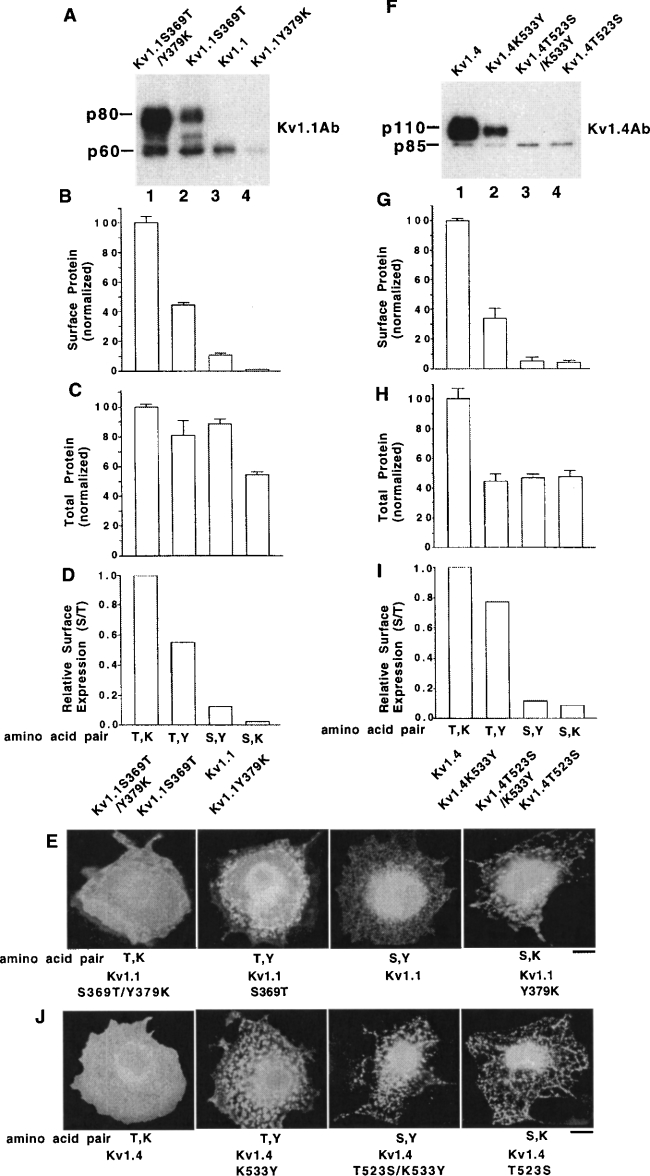
Figure 2. Kv1.1 and Kv1.4 cell-surface levels are governed by two amino acids in their deep pore regions: a Thr/Lys pair in Kv1.4 promoted high surface expression, whereas a Ser/Tyr pair of Kv1.1 inhibited high surface expression by inducing high partial ER retention.
Transiently transfected CHO cells were analysed for their cell-surface protein levels by surface biotinylation/immunoblotting and their total protein levels by immunoblotting. The Kv1 protein's whole cell immunofluorescence localization patterns in transiently transfected permeabilized COS7 cells are also shown. (A) Cell-surface protein profile of Kv1.1 constructs with different amino acid pairs in the deep pore by biotinylation/immunoblotting. (B) Group data for cell-surface expression. Normalized cell-surface protein levels by biotinylation/immunoblotting. The Kv1.1S369T/Y379/K construct value was taken as 100.0±S.E.M. (n=3) and the other construct values were normalized to it. (C) Group data for total protein expression of cells (immunoblots are not shown). The Kv1.1S369T/Y379/K construct value was taken as 100.0±S.E.M. (n=3) and the other construct values were normalized to it. (D) Relative surface expression levels, calculated by dividing the surface values in (B) by the total values in (C). (E) Immunofluorescence localization pattern of Kv1.1 constructs in COS7 cells. Scale bar, 10 μm. (F) Cell-surface protein profile of Kv1.4 constructs with different amino acid pairs in the deep pore by biotinylation/immunoblotting. (G) Group data for cell-surface protein expression. Normalized cell-surface protein levels by biotinylation/immunoblotting. The Kv1.4 construct value was taken as 100.0±S.E.M. (n=3) and the other construct values were normalized to it. (H) Group data for total protein levels of cells (immunoblots are not shown). The Kv1.4 construct value was taken as 100.0±S.E.M. (n=3) and the other construct values were normalized to it. (I) Relative surface expression levels, calculated by dividing the surface values in (G) by the total values in (H). (J) Immunofluorescence localization pattern of Kv1.4 constructs from COS7 cells. Scale bar, 10 μm. Note that, in immunofluorescence micrographs, the important parameter is the localization pattern and not the signal intensity.

