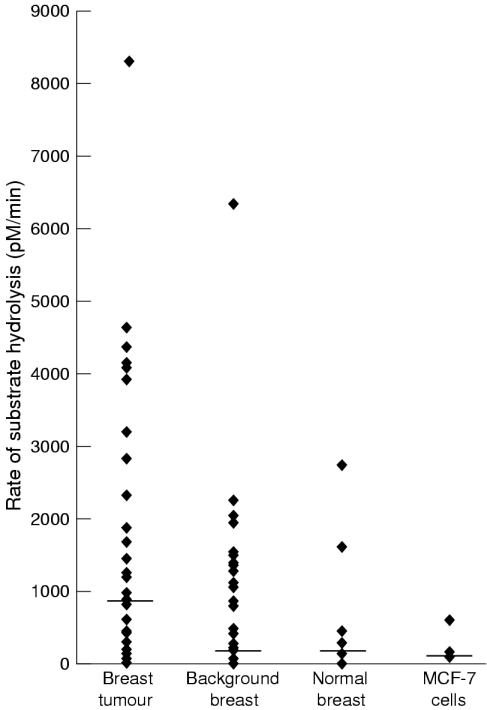
Figure 2.
Graph demonstrating the differences in total matrix metalloproteinase (MMP) activity (rate of substrate hydrolysis) in the different breast tissues studied. The horizontal line corresponds to the median activity for each tissue. Breast tumour tissue had significantly greater MMP activity than the other breast tissues studied (background samples, normal tissue, and MCF-7 cells; ANOVA, p < 0.05, Mann Whitney).

