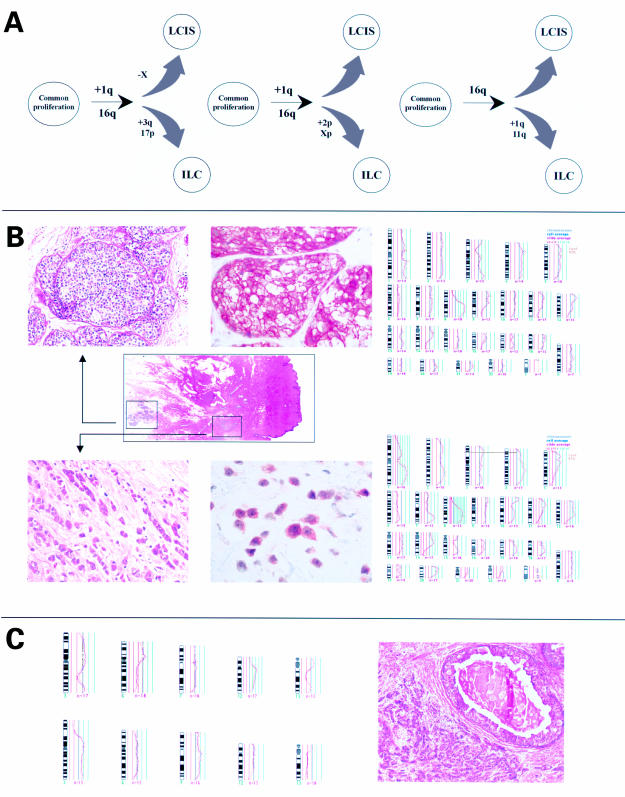
Figure 1.
(A) Three examples of hypothetical models of progression of lobular carcinoma in situ (LCIS) and lobular invasive carcinomas. (B) Comparative genomic hybridisation (CGH) ratio profiles, morphology, and immunohistochemistry of intermediately differentiated ductal carcinoma in situ (DCIS) and lobular invasive carcinomas. Middle row left, overview of the section microdissected. The areas of interest are indicated. Upper row left, intermediately differentiated DCIS; haematoxylin and eosin stained; magnification, ×10. Middle, E-cadherin immunohistochemistry; magnification, ×10. Upper row right, CGH ratio profile of intermediately differentiated DCIS. Lower row left, lobular invasive carcinoma; haematoxylin and eosin stained; magnification, ×40. Lower row central, E-cadherin immunohistochemistry; magnification, ×40. Lower row right, CGH ratio profile of lobular invasive carcinoma. The black central line indicates the fluorescence ratio of balanced DNA sequence copy number state (1.0) between tumour and reference DNA. The red lines to the left represent the 0.75 and 0.5 thresholds for losses, the green lines to the right the 1.25, 1.5, 1.75, etc thresholds for gains. The ratio profiles show the mean green to red ratio (red line) and the 95% confidence limits (yellow lines). Chromosome numbers are indicated. (C) Right, poorly differentiated DCIS and ductal invasive carcinoma grade 3; haematoxylin and eosin stained; magnification, ×5. Right, examples of CGH ratio profiles of five chromosomes with significant differences in the preinvasive and invasive tumour component. Upper right, DCIS; lower right invasive carcinoma.

