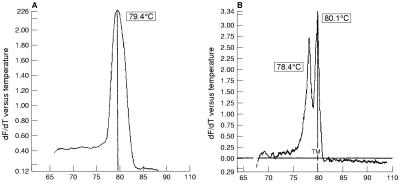
Figure 1.
Melting curve analysis of PCR products after amplification of a 150 bp fragment of the human papillomavirus (HPV) L1 gene. Y axis: negative differential of fluorescence over temperature (−dF/dT). (A) Standard melt analysis of SiHa/HeLa mixed DNA product, using GP5+6+ primers showing single peak (Tm = 79.4°C). (B) Detailed melt analysis of SiHa and HeLa mixed DNA product, showing two peaks with Tm = 78.4°C (HPV-16) and 80.1°C (HPV-18).

