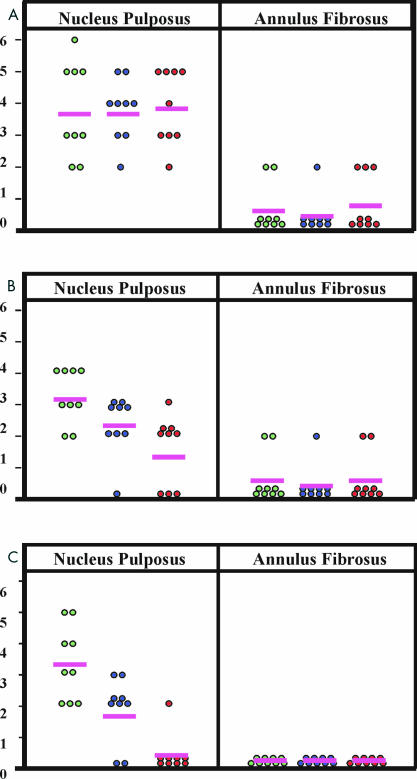
Figure 2.
Graphical representation of the combined score (proportion of cells staining plus the density of the reaction product for all three molecules); (A) Sox9 mRNA, (B) collagen II mRNA, (C) aggrecan core protein. Light green circles, no or minimal degeneration; blue circles, moderate degeneration; red circles, severe degeneration; pink line, mean.

