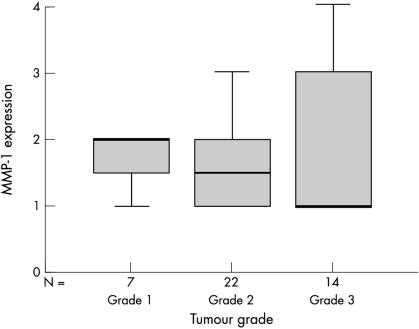
Figure 1.
Box plot showing the negative trend between matrix metalloproteinase 1 (MMP-1) expression (as determined by the staining score) and the grade of breast tumour. The line within the box plot corresponds to the median value, the box length to the interquartile range, and the lines emanating from the box (whiskers) extend to the smallest and largest observations.

