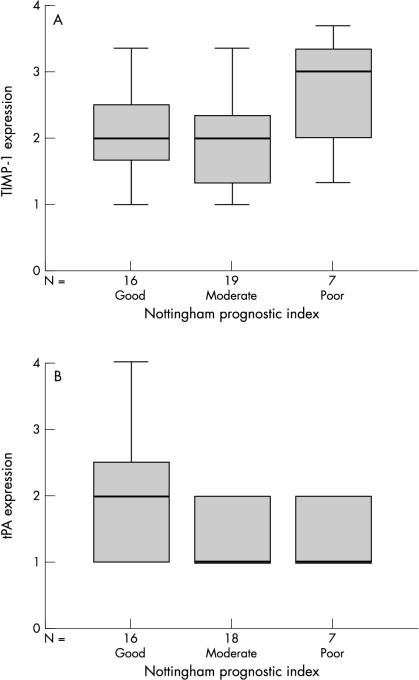
Figure 2.
Box plots demonstrating (A) the positive trend between the expression of tissue inhibitor of metalloproteinases 1 (TIMP-1) and the determined Nottingham prognostic index of the breast tumours; and (B) the significant negative trend between the expression of tissue-type plasminogen activator (tPA; p < 0.05 Spearman’s correlation) and the Nottingham prognostic index of the breast tumours. The line within the box plot corresponds to the median value, the box length to the interquartile range, and the lines emanating from the box (whiskers) extend to the smallest and largest observations.

