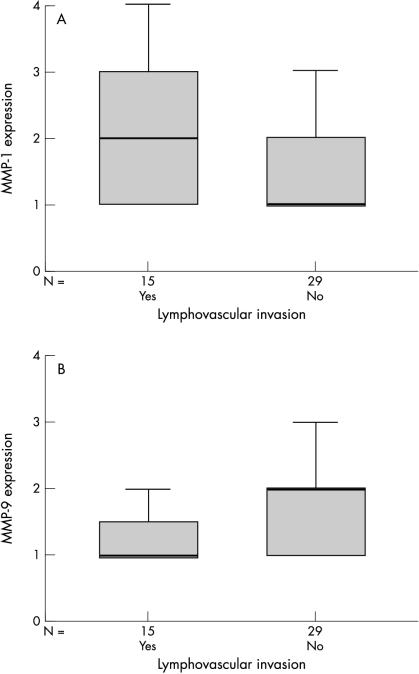
Figure 3.
Box plots demonstrating (A) the significant positive trend between the expression of matrix metalloproteinase 1 (MMP-1; p < 0.05, Spearman’s correlation) and whether the tumours exhibited lymph or vascular invasion at the time of resection; and (B) the negative trend between the expression of MMP-9 and whether the tumours exhibited lymph or vascular invasion at the time of resection. The line within the box plot corresponds to the median value, the box length to the interquartile range, and the lines emanating from the box (whiskers) extend to the smallest and largest observations.

