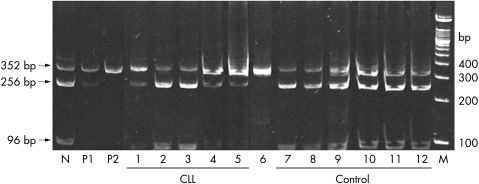
Figure 3.
Restriction enzyme analysis (with Aci I ) for the G(−248)A single nucleotide polymorphism (SNP) in the BAX gene. M, molecular weight marker (100 bp DNA ladder; Gibco BRL); N, control sample showing three distinct bands, 352 256 bp, and 96 bp; P1, positive control with heterozygous SNP showing the 352 bp (major) and 256 bp (minor) bands and an almost invisible 96 bp band; P2, positive control with a homozygous SNP, which abolishes a restriction enzyme site, resulting in a single 352 bp band; lanes 1–5, chronic lymphocytic leukaemia cases; lanes 1, 4, and 5, heterozygous SNP; lanes 2 and 3, no SNP; lane 6, RL showing the homozygous SNP; lanes 7–12, controls without the G(−248)A SNP.

