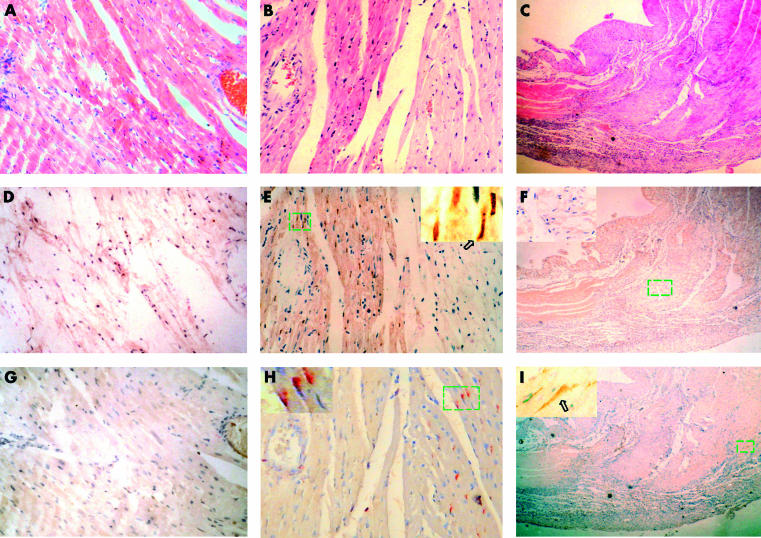
Figure 2.
Serial sections from three different ischaemic time points: (A, D, G), 10 minutes; (B, E, H), 24 hours; and (C, F, I), seven days. (A–C) Haematoxylin and eosin staining; (D–F) in situ terminal deoxynucleotidyl transferase mediated nick end labelling staining; (G–I) immunostaining for Fas. (A, D, G) These serial sections show no eosinophilic regions, no apoptotic cardiomyocytes, and no expression of Fas seen in the 10 minute ischaemia samples, respectively. (B, E, H) These serial sections show that the ischaemic region is in the left half of the field, normal myocardium in the right half, and that cardiomyocytic apoptosis and Fas expression are found in different regions of the myocardium: apoptosis (brown) in the ischaemic region and Fas expression (red) in the regions surrounding the ischaemic myocardium. (C, F, I) These serial sections show that necrotic cardiomyocytes were absorbed and replaced by scar tissue. Fas (brown) was expressed in the perinecrotic region, and apoptotic cardiomyocytes were not detected in the sample after seven days of ligation. Arrows point to positive cells.

