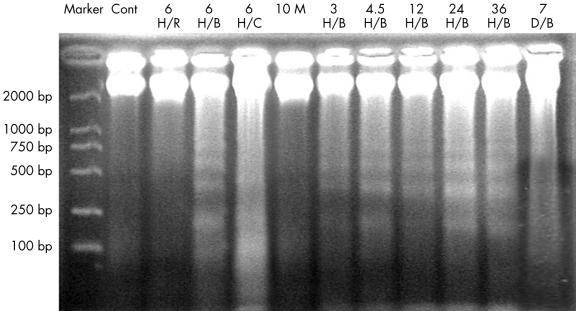
Figure 4.
Gel electrophoresis shows a ladder pattern, characteristic of apoptosis. The DNA isolated from the control (lane Cont), 10 minute ischaemic/infarcted sample (lane 10 M), and a region remote from ischaemia in the three to 36 hour ischaemic/infarcted sample (lane 6 H/R) does not show the ladder pattern. DNA isolated from the border zones of ischaemia (lanes 6 H/B, 3 H/B, 4.5 H/B, 12 H/B, 24 H/B, and 36 H/B represent the six, three, 4.5, 12, 24, and 36 hour ischaemic/infarcted groups, respectively) shows the ladder pattern. DNA isolated from the central areas of ischaemia (lane 6 H/C) shows less specific degradation (a smear). DNA isolated from the border zones in the seven day ischaemic/infarcted group shows no ladder pattern (lane 7 D/B). DNA in lanes 6 H/R, 6 H/B, and 6H/C is isolated from the region remote to ischaemia, border zones, and central areas of a six hour ischaemic/infarcted sample, respectively.

