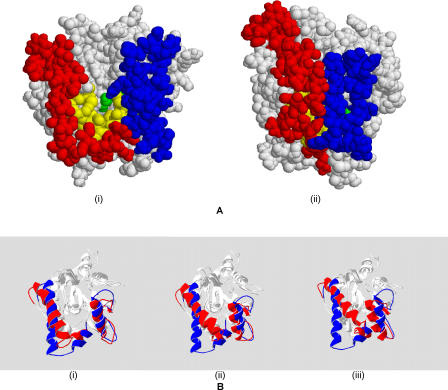
Figure 2. Lid Movement in P. aeruginosa Lipase: Qualitative Representation.
(A) This figure represents the simulation results. The structure on the left (i) is the open form of the lipase, which reveals the active site cavity. Binding pocket residues are coloured yellow, and lid residues red (lid1) and blue (lid2). There appears to be nearly a 100% decrease in the solvent-accessible area when the lids close (structure on right [ii]).
(B) Time evolution of the structure backbone is shown. Blue corresponds to the open crystal structure of the lipase, while red indicates the position of the lids after 3 ns (left [i]), 7 ns (centre [ii]), and 10 ns (right [iii]).

