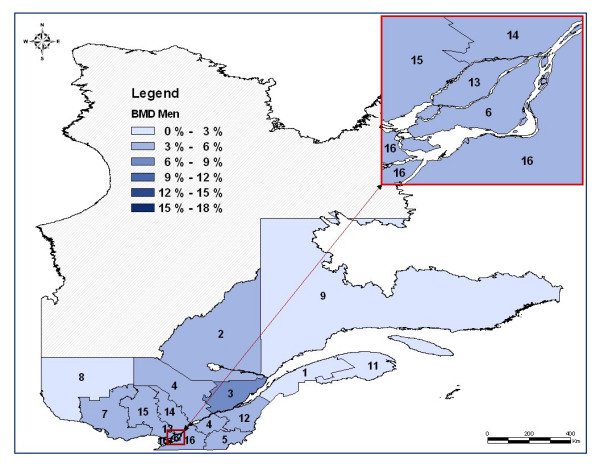
Figure 2.

Map of the regional age-adjusted rates of bone mineral density (BMD) measurement two years after a fragility fracture in men after classification*. * Administrative regions: 1 : Lower St. Lawrence; 2 : Saguenay-Lac-St-Jean; 3: Quebec City; 4: Mauricie, Central Quebec; 5: Eastern Townships; 6: Montreal Center; 7: Outaouais; 8: Abitibi-Témiscamingue; 9: North Shore; 11: Gaspé, Magdalen Islands; 12: Chaudière-Appalaches; 13: Laval; 14: Lanaudière; 15: Laurentians; 16: Montérégie
