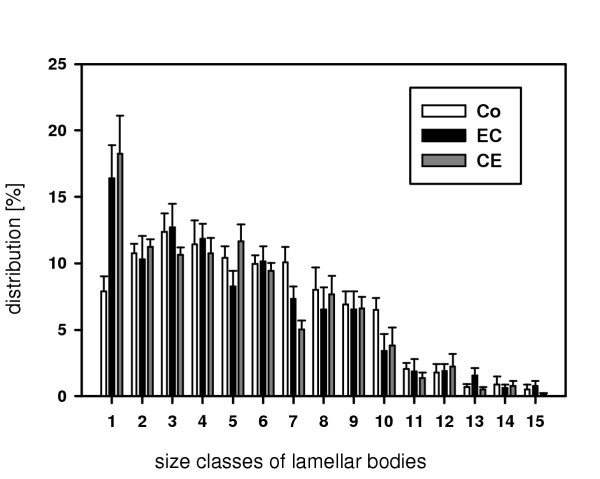
Figure 7.
Histogram of lamellar body size classes. Distribution of lamellar body size classes (increasing from 1 to 15) after ischemia and reperfusion (IR) following preservation with either Celsior or EuroCollins compared to control lungs as determined by the point sampled intercepts method. After IR, lamellar bodies of size class1 (smallest size) differ significantly from controls (Celsior: p = 0.032; EuroCollins: p = 0.028). Bars represent means ± SD.

