
Figure 6.
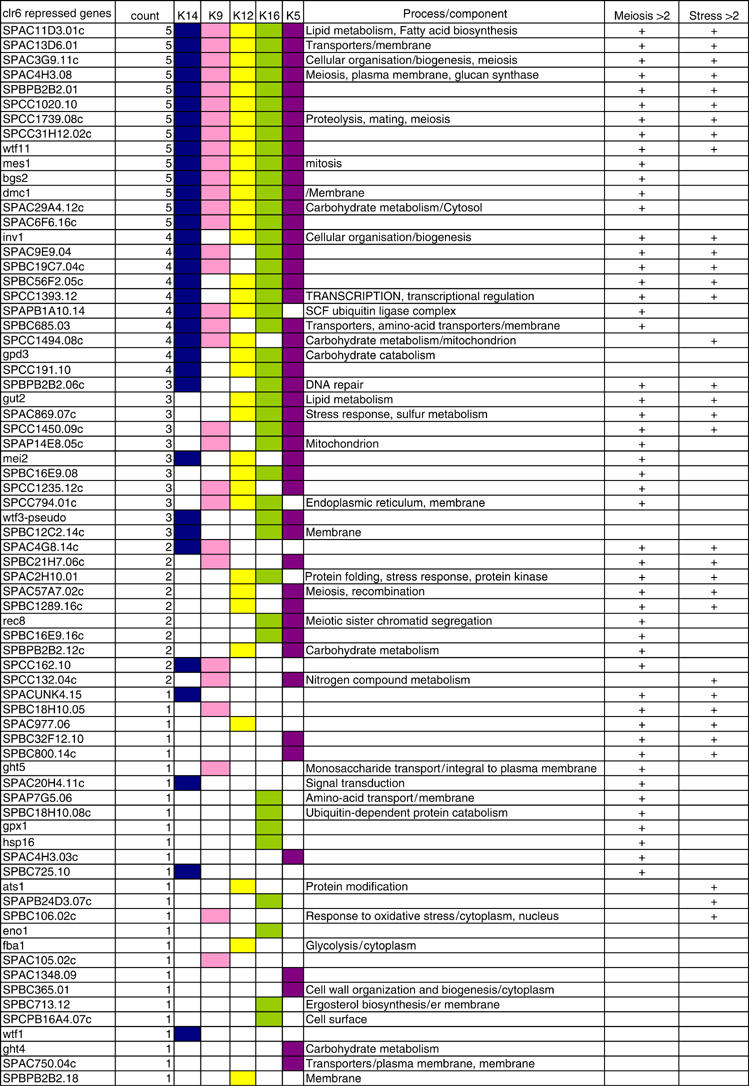
Comparison of Clr6 enzyme activity at IGRs of genes repressed by Clr6. A list of gene names for 72 Clr6 repressed genes (cut off 1.5) for which acetylation is increased in the IGR regions as compared to wt. The ‘count' indicates at how many of the five acetylation sites which IGR acetylation increased, and the colored boxes indicate each site affected by Clr6. The processes and components column indicates the GO associations found for each gene. In the meiosis column (>2.0-fold), a plus sign indicates if a given gene is upregulated during meiosis (Mata et al, 2002), and in the stress (>2.0-fold) column a plus sign indicates if the gene is upregulated at any of the published data sets for environmental stress (Cd, heat, H2O2 or sorbitol) (Chen et al, 2003).