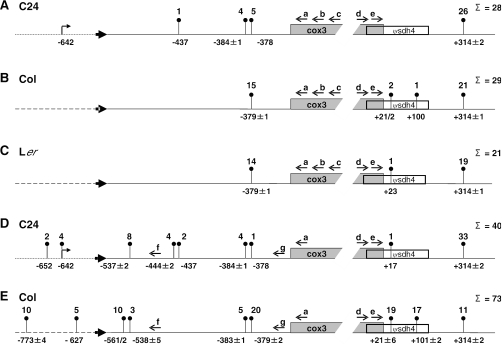
Figure 5.
CR–RT–PCR mapping of the 5′ and 3′ extremities of Atcox3 transcripts from ecotypes C24, Col and Ler. Analyses were performed with total RNA from green seedlings (A–C) and mtRNA from cell suspension cultures (D and E). The number of individual clones analyzed is given in the right margin. Prominent ends found in several clones are indicated by pins with number of clones above. The continuous line represents sequences identical in all investigated ecotypes; dashed lines are identical in Col and Ler; the dotted line is specific for C24 in this position. The locations of the ends are given in respect to the ATG or the stop codon of the Atcox3 gene. Primers (open arrows) used in the CR–RT–PCR are a: Atcox3-1; b: Atcox3-2; c: Atcox3-3PS; d: Atcox3-4; e: Atcox3-5; f: ATB2174-2; g: Atcox3-3.

