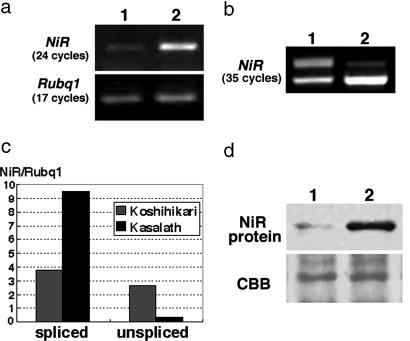
Fig. 4.
Comparison of NiR expression. (a) Semiquantitative RT-PCR analysis of NiR expression performed with primers A and A′ indicated in Fig. 3a. NiR was detected at 24 cycles. Rubq1, detected at 17 cycles, was used as a control. Lane 1, Koshihikari; lane 2, Kasalath. (b) Saturated RT-PCR analysis of NiR expression performed with primers B and B′ indicated in Fig. 3a. NiR was detected at 35 cycles. Lane 1, Koshihikari; lane 2, Kasalath. (Upper) The unspliced transcript. (Lower) The correctly spliced transcript. (c) Real-time PCR analysis of NiR expression. Expression levels were normalized by using Rubq1. (d) Immunoblot analysis of the crude extract from Koshihikari (lane 1) and Kasalath (lane 2) calli with antibody against NiR. The Coomassie brilliant blue (CBB)-stained RbcS protein was used as a loading control.

