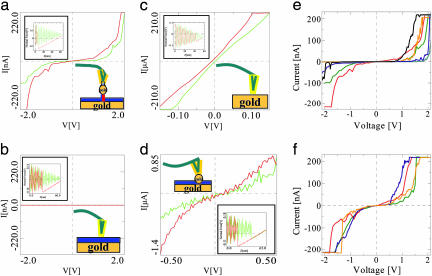
Fig. 3.
I–V curves that were measured at a preset height above the surface at the closest point to the surface during force–distance measurements (shown in the insets). The approach in measurements a–c was halted just before the JTC of the tip to avoid pressure on the surface or the particle underneath. The hysteresis in the backward curves in the insets is caused by adhesion and indicates that good contact was established with the surface or the particle underneath. The green curves are the “forward” and were measured first; the red curves are the “backward” and were measured after the green ones. It can be observed that the current values in the red curves are usually higher than those of the green curves. This is probably because of the formation of improved contact between the metal tip and the particle or the surface during the first measurement. (a) This measurement was performed on a metal particle without pressing on it, as seen in the inset. The current measured is >220 nA at 2 V. (b) I–V curve, measured on the ssDNA monolayer without pressing it. Negligible current was observed here, indicating that the monolayer is insulating. (c) A measurement that was taken on a bare gold surface showing ohmic behavior, as expected from metal–metal contact. The resistance here is ≈500 Ω. (d) I–V curve measured on a metal particle, connected to the surface through a dsDNA while pressing it strongly to the metal substrate, as seen in the force–distance curve in the inset. This curve also shows a nearly linear behavior. (e and f) Two sets of I–V curves that were measured on different GNPs on different samples, tips, and dates, which demonstrate the variation in the data. Lower maximal currents were measured as well in many cases (not shown). e emphasizes curves with a gap, whereas f emphasizes curves with a nonzero or small gap.

