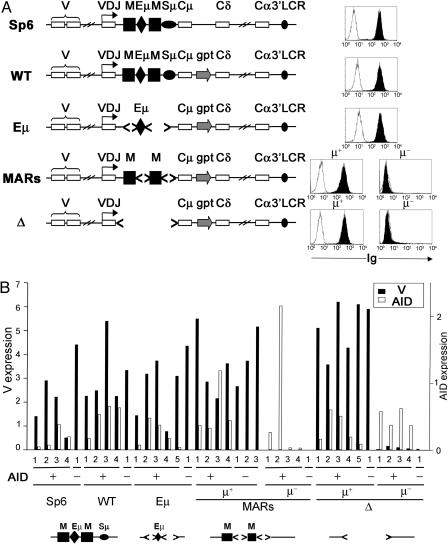
Fig. 1.
A hybridoma cell system to study the role of the intronic elements in SHM. (A) In the IgH locus of the hybridoma cells used in this study, exons are shown as white rectangles, and cis-acting elements are shown as black shapes. M, MAR; Sμ, μ switch region, 3′LCR, 3′ α regulatory elements. The gpt selectable marker is shown as an arrow. < > indicate deletions. The WT, Eμ, MARs, and Δ recombinants are derived by homologous recombination from a mutant of Sp6, as described in the text. Flow cytometry profiles of hybridomas for IgM (black histograms) and IgG (white histograms) are shown to the right. Note that MARs and Δ recombinants generate μ+ or μ- subclones. (B) Quantitative RT-PCR results of V region and hAID mRNA measurements. Expression levels relative to GADPH are shown on the y axis as indicated. Several transfectants of each recombinant, indicated by numbers, were analyzed.

