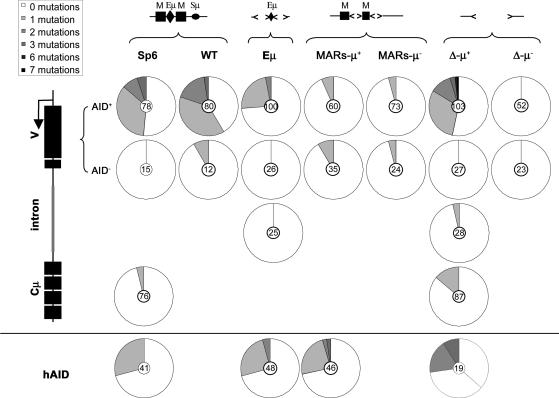
Fig. 2.
The extent of SHM in hybridoma transfectants. Mutations were assessed in the regions indicated in AID transfectants (V-AID+, Intron, Cμ, and hAID) and pCEP-transfected controls (AID-). The structure of the J–C intron of the hybridomas analyzed is shown above the pie charts. Pie charts indicate the fraction of DNA molecules analyzed bearing 0–7 mutations. The numbers in the middle of the pie charts indicate the total number of DNA molecules analyzed.

