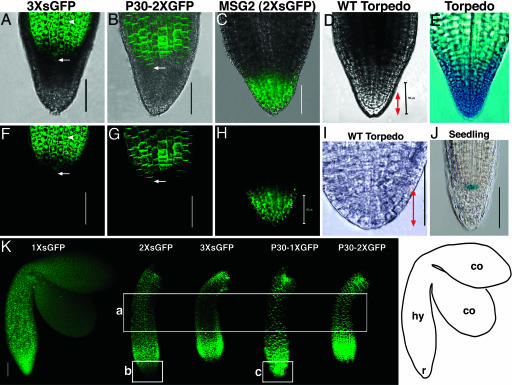
Fig. 4.
Movement of 3× sGFP and P30–2× GFP in roots of midtorpedo embryos. Overlapping bright field and green GFP fluorescence (A–C) and GFP fluorescence alone (F–H) are shown. (D and I) Wild-type embryo roots in bright field. (E) Torpedo embryo root showing root cap-specific GUS expression. (J) Seedling root showing quiescent center-specific GUS expression in line QC25 (29). (K) GFP signal in midtorpedo embryos; a, the mid region of hypocotyls; b and c, roots. Arrows indicate cells that mark the boundary between the hypocotyl (hy) and the root (r) in A, B, F, and G. Arrowheads shows nuclear localization of 3× sGFP (A and F). Bidirectional red arrows (D and I) indicate the central root cap. (Scale bars, 50 μm.) Image in I was adapted with permission from ref. 14. [Image in E reprinted with permission from ref. 26 (Copyright 1999, Company of Biologists, Ltd.).]

