
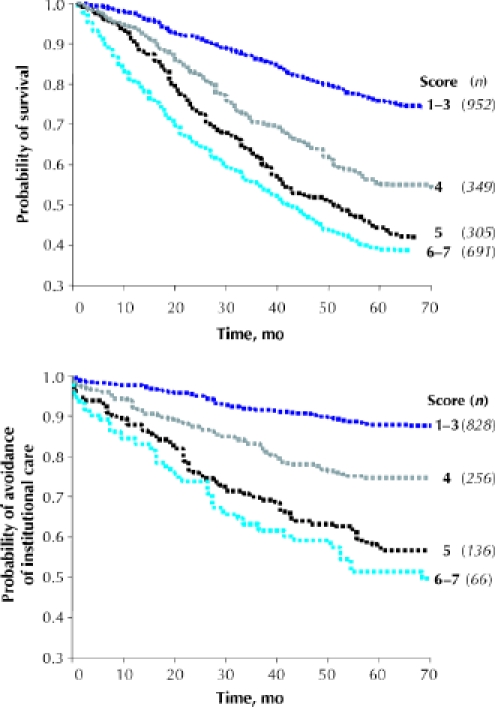
Fig. 1: Kaplan–Meier curves, adjusted for age and sex, for study participants (n) over the medium term (5–6 years), according to their scores on the CSHA Clinical Frailty Scale. Some scores were grouped. Top: Probability of survival. Bottom: Probability of avoidance of institutional care.