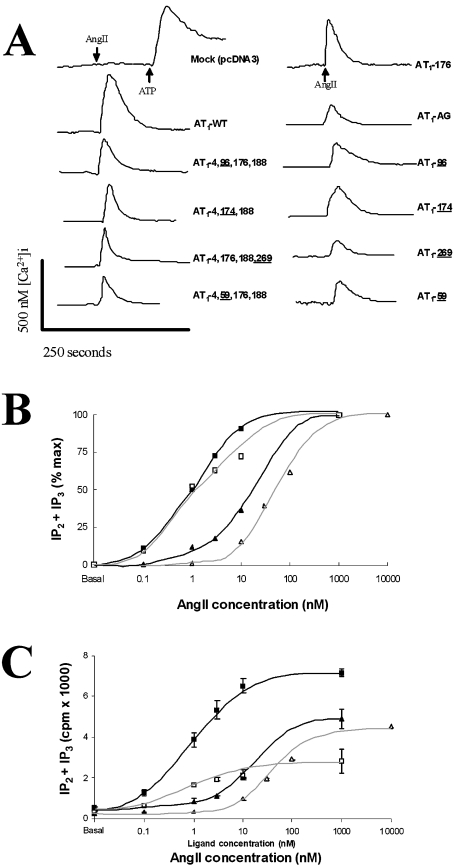
Figure 3. Functionality of AT1 receptor glycosylation mutants.
(A) COS-7 cells were transiently transfected with pcDNA3 vector (mock) or the various mutant receptors, loaded with fura 2/AM and mounted on a video-microscopy system. fura 2 fluorescence was monitored under basal conditions and after stimulation with 100 nM AngII. Mock-transfected cells were also stimulated with 100 μM ATP. These typical traces show variations of the fluorescence ratio (F334/F380), as described in the Experimental section. Similar results were obtained with three different cell preparations. (B) Production of inositol phosphates is expressed as a percentage of maximal stimulation of COS-7 cells expressing AT1-4,176,188 (WT, ■), AT1-4,96,176,188 (ECL1, △), AT1-4,174,188 (ECL2, ▲), AT1-4,176,188,269 (ECL3, □); and (C) the results are expressed as absolute values [sum of IP2+IP3, where IP2 is Ins(4,5)P2 and IP3 is Ins(1,4,5)P3]. The results are expressed as the means±S.D. of duplicate values and are representative of two independent experiments.

