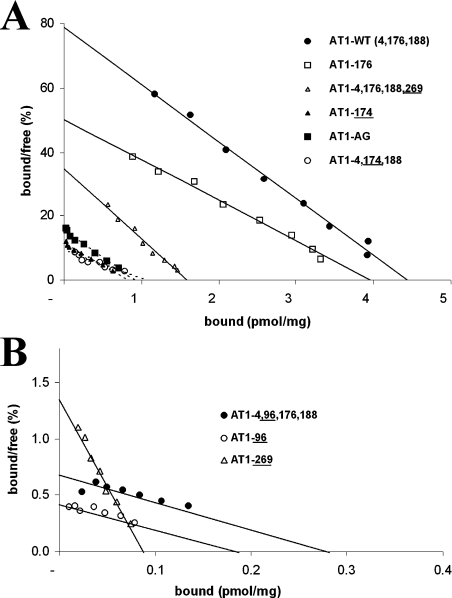
Figure 4. Pharmacological properties of AT1 receptor glycosylation mutants.
Broken COS-7 cells expressing the AT1-WT receptor and various glycosylation mutants were incubated for 1 h with increasing concentrations of 125I-[Sar1,Ile8]AngII. Non-specific binding was assessed in the presence of 1 μM unlabelled [Sar1,Ile8]AngII. Affinity (Kd) and Bmax values were evaluated from the saturation curve data by Scatchard analysis, which is shown to emphasize the decrease in Bmax (A) and the decrease in both Bmax and Kd of the ECL1 mutants (B). Each data point represents the mean of triplicate values. These results are representative of at least three independent experiments.

