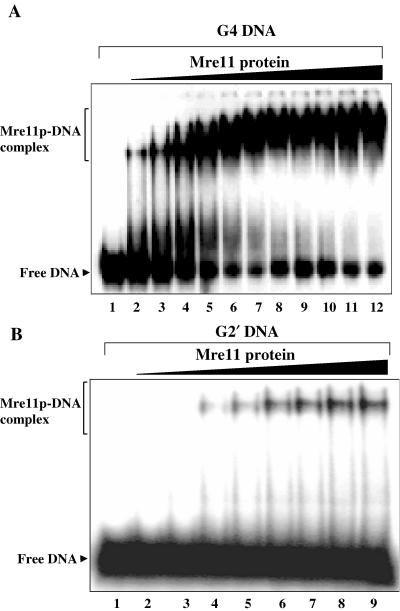
Figure 6.
ScMre11p displays higher affinity for G4 DNA over G2′ DNA. (A) Reaction mixtures contained 3 nM 32P-labeled G4 DNA (lane 1) and ScMre11p at 50, 75, 100, 125, 150, 175, 200, 225, 250, 275 and 300 nM (lanes 2–12). (B) Reaction mixtures contained 3 nM 32P-labeled G2′ DNA (lane 1) and ScMre11p at 0.25, 0.5, 0.75, 1, 1.25, 1.5, 1.75 and 2 μM (lanes 2–9). Samples were analyzed as described in Materials and Methods.

