Figure 7.
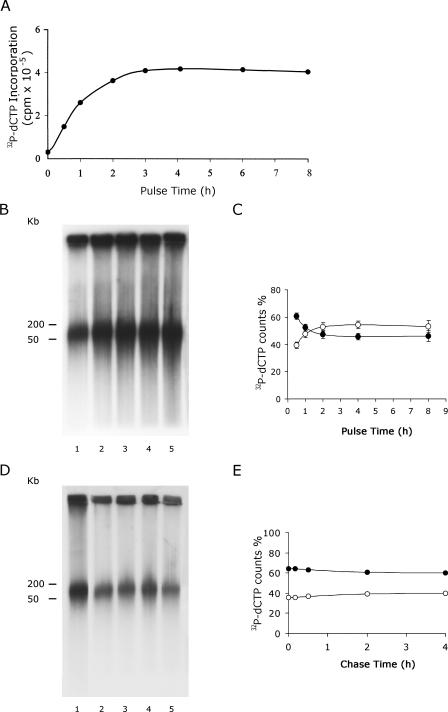
In vitro mitochondrial-nucleoid DNA synthesis with different pulse and chase periods. Nucleoids samples isolated from mitochondria equivalent to 2 mg protein were incubated at 30°C in a DNA-synthesis reaction mixture in the presence of 32P-dCTP. At 0, 0.5, 1, 2, 3, 4, 6 and 8 h, duplicate aliquots were taken, one was used for 32P-dCTP incorporation determination and the other was processed for fractionation analysis. (A) Kinetics of mitochondrial-nucleoid DNA synthesis in vitro. (B) PFGE autoradiogram of mitochondrial-nucleoid DNA synthesized at various pulse time. Lanes 1–5 present samples taken at 0.5, 1, 2, 4 and 8 h pulse-labeling time, respectively. (C) Graphic representation of the newly synthesized well-bound form (closed circle) and fast-moving form (open circle) were plotted over the total of the newly synthesized mitochondrial-nucleoid DNA. Fractions of well-bound (wb) and 50–200 kb fast-moving (fm) DNA were cut out from the gel and counted. The percentage of newly synthesized wb DNA was calculated as (c.p.m. of wb DNA)/(c.p.m. of wb DNA + c.p.m. of fm DNA). The percentage of newly synthesized fm form was calculated similarly. The average results of four repeated experiments are shown with the standard deviation (vertical bar). (D) PFGE autoradiogram of newly synthesized mtDNA after various chase periods. Lanes 1–5 represent 0, 10, 30 min, 2 and 4 h chase, respectively, after an 1 h pulse. (E) Proportion of newly synthesized wb and fm DNA corresponding to (D).

