
FIGURE E3.
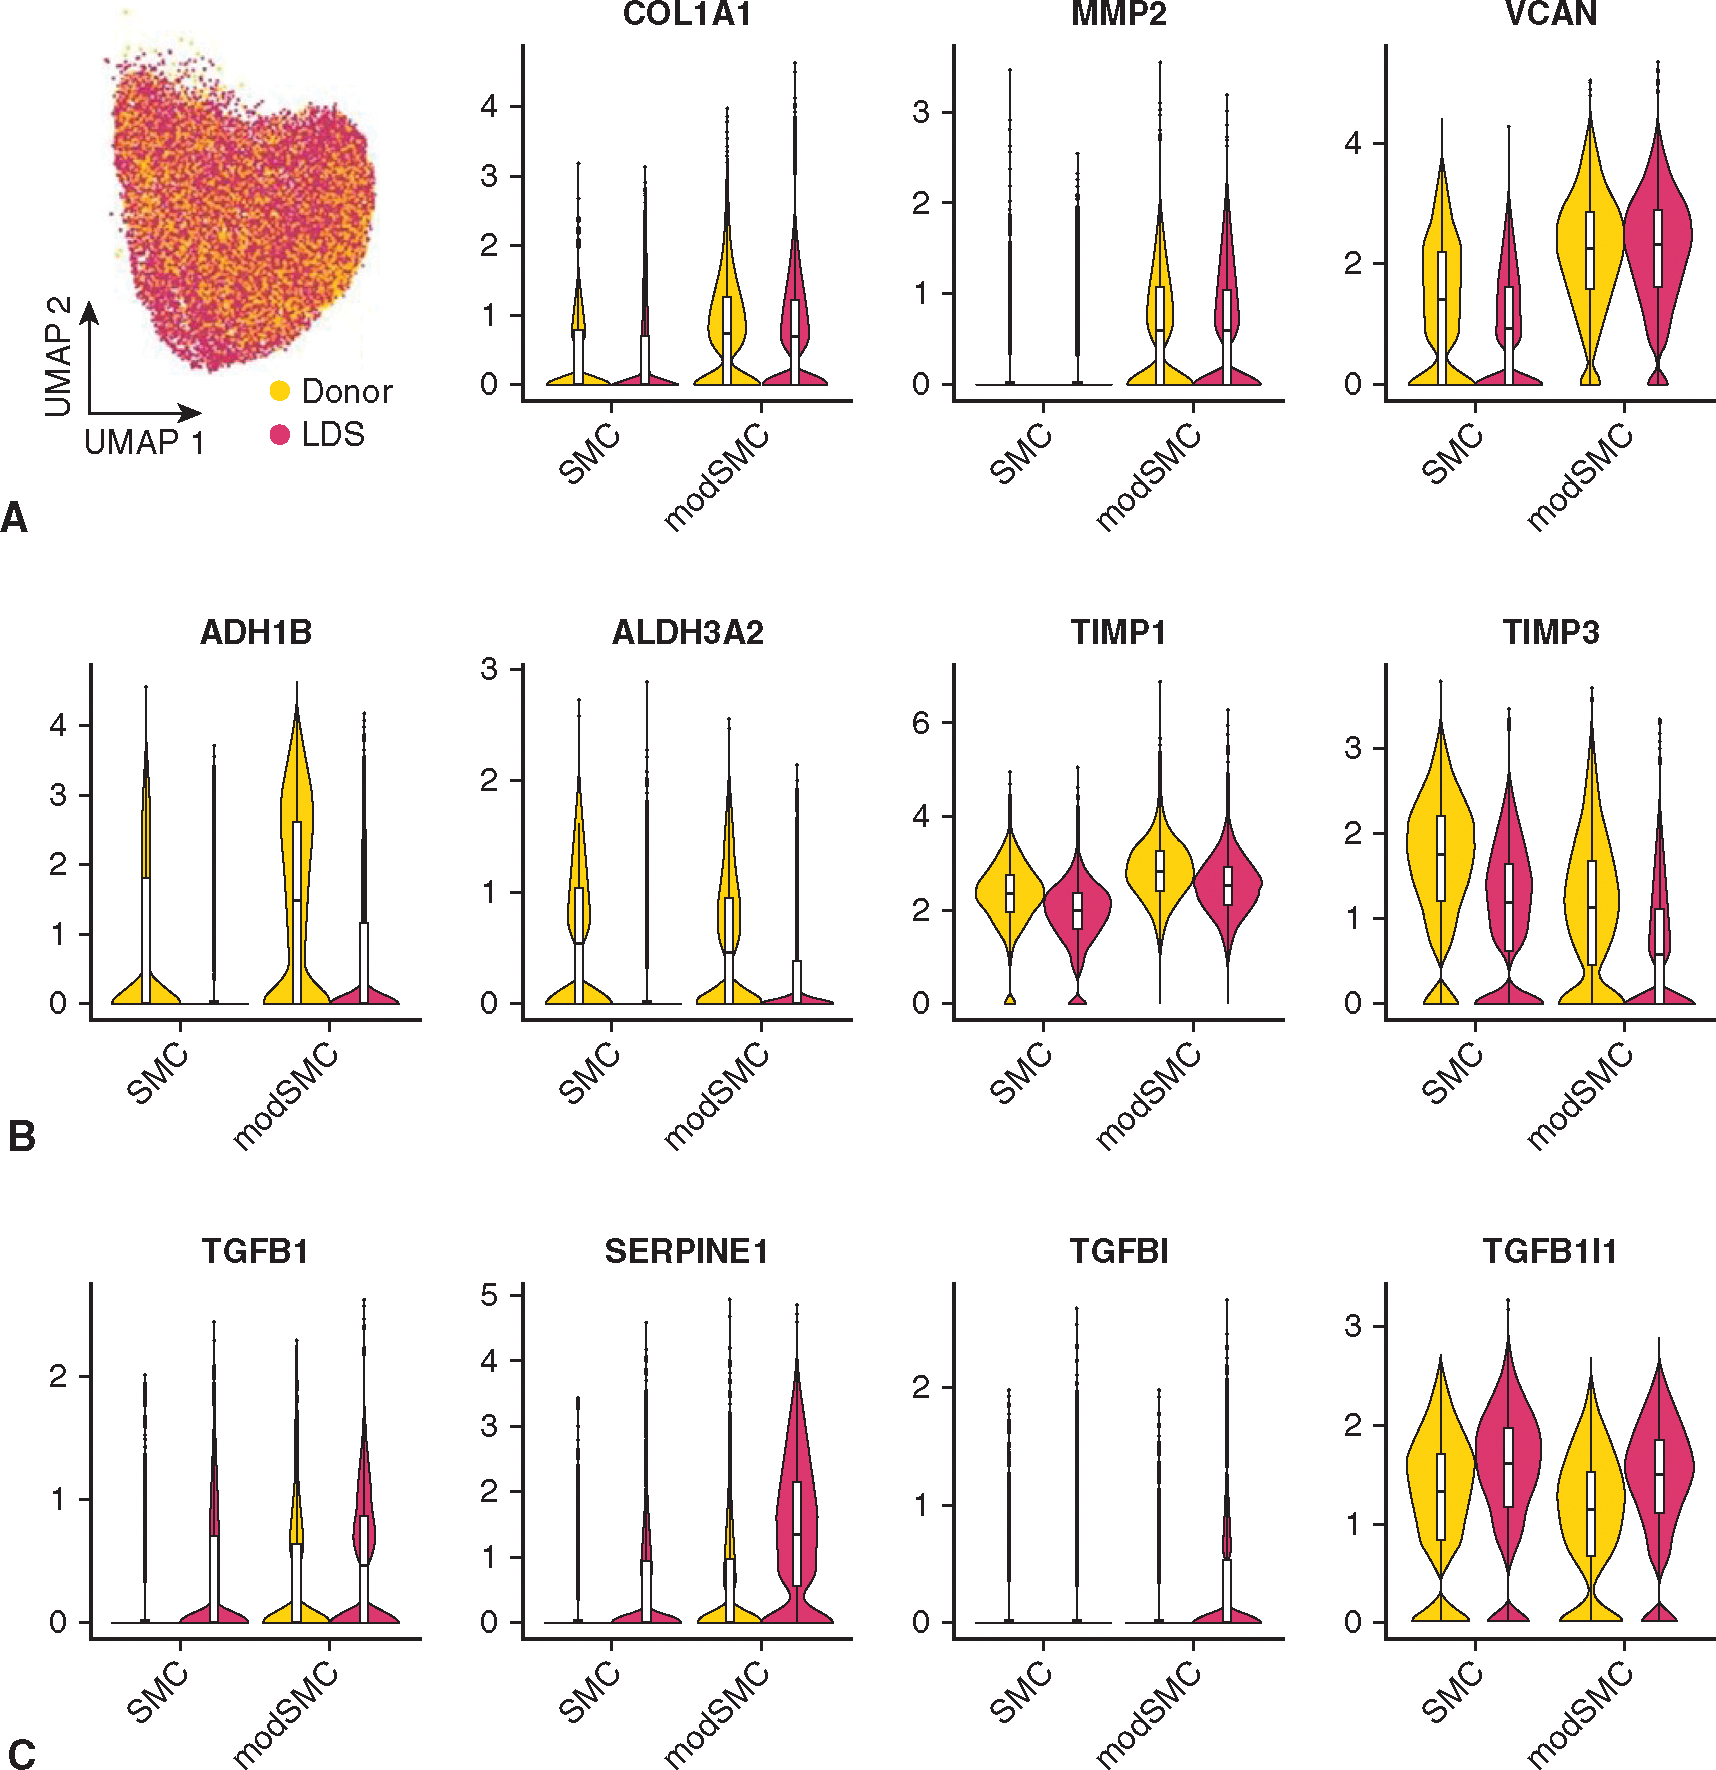
Differential gene expression in LDS and donor control SMC clusters. A, Uniform manifold approximation and projection (UMAP) plot for SMC + modSMC clusters with generally overlapping distributions between LDS and control. modSMCs show similar overexpression of core markers (COL1A1, MMP2, VCAN) regardless of genotype. B, Gene markers enriched in donor SMCs among 436 differentially expressed genes. C, TGF-β–related genes among those enriched in LDS SMC/modSMCs. LDS, Loeys-Dietz syndrome; SMC, smooth muscle cell.