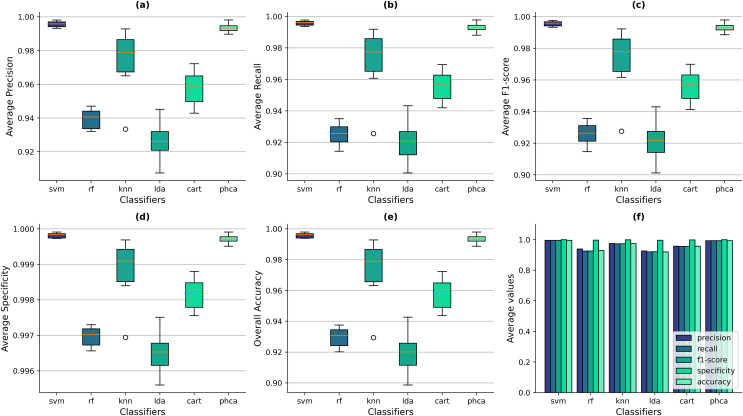
Figure 7. Distribution of performance metrics obtained by PHCA and the classical classifiers for the Imbalanced dataset.
Ten (10) trials are implemented, each with a different train-test split. Shown are the box-and-whisker plots of the resulting average precision (A), recall (B), F1-score (C), specificity (D), and overall accuracy (E). Shown also are the average metric values obtained by the classifiers across all 10 trials (F).

