

Abstract
The global prevalence of diabetes, a chronic condition that disrupts glucose homeostasis, is rapidly increasing. Patients with diabetes face heightened challenges due to the COVID-19 pandemic, which exacerbates symptoms associated with the severe acute respiratory syndrome coronavirus 2 (SARS-CoV-2) infection. In this study, we developed a mathematical model utilizing the Mittag–Leffler kernel in conjunction with a generalized fractal fractional operator to explore the complex dynamics of diabetes progression and control. This model effectively captures the disease’s inherent memory effects and delayed responses, demonstrating improved accuracy over traditional integer-order models. We identified a single equilibrium point that represents the stable glucose level in healthy individuals. To establish the existence and uniqueness of the model, we employed fixed point theory alongside the Lipschitz condition. The Ulam–Hyers stability of the proposed model was also examined. Subsequently, we analyzed the chaotic behavior of the diabetic model using feedback control approaches, focusing on controllability and PID techniques. The application of chaos theory revealed that glucose-insulin dynamics are highly sensitive to initial conditions, leading to complex oscillatory behavior that can result in unstable glucose levels. By implementing fractional-order PID controllers, we effectively stabilized chaotic glucose dynamics, achieving more reliable blood sugar regulation compared to conventional methods, with a notable reduction in oscillation amplitude. We conducted numerical simulations to validate our findings, employing the Newton polynomial method across various fractal and fractional order values to assess the robustness of the results. A discussion of the graphical outcomes from the numerical simulations, conducted using MATLAB version 18, is provided, illustrating the dynamics of glucose regulation under different fractal-fractional orders. This comprehensive approach enhances our understanding of the underlying mechanics driving chaotic behavior in glucose-insulin dynamics.
Keywords: Diabetes model, Ulam–Hyers Stability, Chaos control, Fractal-fractional operator, Mittag–Leffer kernel
Subject terms: Applied mathematics, Computational science
Introduction
Chronic metabolic diseases like diabetes mellitus remain a major worldwide health concern. It is distinguished by chronic hyperglycemia brought on by insufficiency in either the production or the action of insulin, or both. These physiological abnormalities highlight the critical function of insulin as an anabolic hormone by interfering with the metabolism of proteins, fats, and sugar. Diabetics are at a higher risk of coronary artery disease and have a fourfold increased risk of stroke. Untreated diabetes can have dangerous consequences, such as vision problems that increase the risk of infection, blindness, and unconsciousness. However, certain people, especially children, may exhibit obvious symptoms such as impaired vision, increased appetite (polyphagia), excessive thirst (polydipsia), excessive urination (polyuria), and abrupt weight loss if they have a full insulin deficiency. The International Diabetes Federation (IDF) estimated that 415 million individuals aged 20 to 79 had diabetes mellitus in 2015. According to projections, population concern will have risen by an additional 200 million come the year 20401. Today, the problem is global, and according to the data obtained in 2021, about 537 million people, or 10.5% of the world’s population suffer from diabetes2. It is projected that these numbers could increase to 643 million by 2030 and increase to 783 million by 20453. These statistics bring out the importance of screening and assessment approaches in diabetes intervention. The etiopathogenesis of diabetes mellitus genetic factors comprises an extensive range including changes in genes concerning insulin synthesis, secretion, and degradation. Diabetes mellitus can be defined by multiple distortions in protein and lipid balance, as well as global glucose balance. The knowledge of this type of diabetes mellitus has several etiology, the detailed look at the different pathophysiologic processes involved, and developing treatment strategies to address those pathophysiologic processes has been the purpose of many researches as knowledge in this area expands4. There is a close relationship between COVID-19 and diabetes; COVID-19 worsens diabetes and makes its management more challenging. Some preliminary research shows that patients with diabetes who get infected with COVID-19 have worsened outcomes and have more extended symptoms, like fatigue and higher glucose levels. For example, one research found that 44% of diabetic patients tested for high blood sugar after being cured of COVID-19, and the long-term side effects of the virus are consistent with Chronic Fatigue Syndrome, such as fatigue and headache5. COVID-19 from a physiological perspective might affect the pancreas causing inflammation and damaging its function to provide adequate insulin leading to strong hyperglycemia complications6. Besides, COVID-19 has caused higher levels of stress and the disruption of normal diabetic care, worse glycemic control, and higher rates of incident diabetes. The Centers for Disease Control and Prevention has stated that patients with Type 1 and Type 2 diabetes are among those at a higher risk for the severity of COVID-19 due to impaired immune functions7. Thus, the pandemic does not only endanger the primary lives of diabetes patients but also comes with long-term implications for diabetes care and health results.
Atangana8 has introduced a completely innovative methodology for fractional calculus referred to as the fractal fractional derivative. The traditional methodology is augmented by this innovative technique about fractal fractions9,10. This development facilitates the simultaneous examination of fractional operators and fractal dimensions during the analysis of fractal fractional derivatives. Creating models that more precisely represent memory-effect systems is a huge advantage of this operator. Here some latest research related to fractional, the Mittag–Leffler function is used in a COVID-19 epidemic model11 to better understand the complicated dynamics and stability of disease dissemination. Its findings help in the development of more accurate estimates and control methods for epidemic control. The interplay between diabetes and COVID-19 using a fractal-fractional model12, offering insights into how co-infections impact disease dynamics. The study13 establishes conditions for the uniqueness and existence of positive solutions for a class of fractional integro-differential equations, highlighting how specific constraints ensure these solutions. Identifies conditions under which positive solutions exist or do not exist for a fractional coupled system involving the generalized p-Laplacian14, shedding light on the role of fractional operators and nonlinearity in solution behavior. Fractional capacities to bounded open Lipschitz sets and their complements15, providing insights into how these capacities behave under fractional order settings and their impact on boundary conditions in mathematical analysis. The study16 introduces the M-truncate derivative to define the coupled fractional nonlinear Hirota equation and employs fractional functional and simple equation methods to derive new periodic and solitary wave solutions, enhancing the understanding of such equations. In17, an innovative computational techniques for solving fractional coupled nonlinear Helmholtz equations, providing robust solutions and demonstrating their efficiency through numerical simulations. Traces the fractional temperature field18, revealing how fractional-order derivatives model the diffusion process, capturing anomalous heat transfer behaviors more accurately than classical models. 19provided an insight into its long-term fluctuations and variance scaling, which differ from standard Brownian motion due to memory and dependency structures. A highly efficient numerical scheme for fractional evolution equations of distinct types20, showcasing its accuracy and stability in various applications. The study21 proposes new optical soliton solutions for fractional perturbed Schrödinger equations, advancing the understanding of optical fiber communication systems. Ebola virus dynamics using a piecewise hybrid fractional operator with the Mittag–Leffler kernel22, enhancing the understanding of epidemic progression and control on diverse time scales. A mathematical model of malaria transmission in Yemen23, utilizing piecewise Caputo-Fabrizio derivatives to capture complex dynamics and predict cases from 2022 to 2024, aiding in disease control and prevention. A novel fractional mathematical model using a  -piecewise hybrid fractional derivative approach to analyze Ebola virus disease (EVD) transmission dynamics24, providing valuable insights for developing effective control strategies. The study25 introduces a Hepatitis B virus (HBV) model incorporating asymptomatic carriers, utilizing piecewise fractional-order derivatives to capture complex transmission dynamics, and provides comprehensive theoretical and numerical analysis to enhance understanding of HBV spread. A dengue model with fractal-fractional derivatives analyzes dynamics26, stability, and computing the basic reproduction number to enhance understanding of dengue transmission and inform effective control strategies. In27, a fractional-order model for forest resource conservation, addressing chaos control in the context of toxin activity and human-caused fires. The study28 uses a fractional-order kinetic model to analyze oleic acid epoxidation, with a focus on Ulam–Hyers stability. Its insights help improve reaction stability and efficiency in chemical processes involving oleic acid epoxidation. In study29 applies computational techniques to monitor a fractional-order model of type-1 diabetes, aiding in the feedback design of artificial pancreas systems. In30, the glucose-insulin-glucagon regulatory system in type I diabetes is analyzed using the Mittag–Leffler kernel, providing insights into the intricate dynamics of blood sugar regulation.
Fractional calculus has a long history and is used widely in the simulation of real-world physical phenomena. Fractional calculus studies have attracted a lot of attention lately. In31, the diabetes model study is given; we modified the existing model and developed new results. The fractal-fractional Mittag–Leffler function has become an essential tool in mathematical modeling, particularly in systems with complex, memory-dependent dynamics like biological processes. In diabetes research, where the body’s glucose-insulin interaction is both nonlinear and subject to fractional memory effects, this approach holds significant promise. The fractional order model offers a deeper understanding of glucose-insulin regulation. Capturing complex dynamics, empowers more accurate monitoring and management of diabetes. Embrace this cutting-edge approach to improve patient outcomes. Together, we can transform healthcare with precision and innovation. The fractal-fractional Mittag–Leffler function can capture intricate feedback mechanisms and time-varying interactions, offering a nuanced view of glucose fluctuations and insulin regulation. Modeling diabetes with this framework enables researchers to explore more accurate predictions and personalized treatment strategies, advancing the understanding and management of this chronic condition in ways that traditional models simply cannot achieve. The choice of the fractal fractional derivative and the Mittag–Leffler kernel is motivated by their ability to model memory effects and complex, non-local interactions in glucose-insulin dynamics. These operators capture the inherent irregularities and scale-dependent behavior of biological systems more effectively than classical models. The Mittag–Leffler kernel’s flexibility allows for precise control over the decay and persistence of past states, while the fractal fractional derivative accommodates self-similar patterns in the system. Together, they provide a more accurate and robust framework for modeling diabetes dynamics compared to traditional differential approaches. Existing integer-order models of diabetes often fail to capture the complex, non-linear interactions and memory effects inherent in glucose-insulin dynamics. These models assume instantaneous responses, neglecting the gradual influence of past states on the system. In contrast, the proposed fractional-order model accounts for these memory effects, offering a more realistic representation of glucose regulation and improved control over glycemic variability. The fractal fractional derivative operator is employed in this research to capture the complex, dynamic nature of glucose-insulin interactions more effectively than traditional approaches, ultimately enhancing the understanding and management of diabetes.
The following sections of the document are organized as described: “Basic concepts” presents several key definitions and notations related to fractional calculus. In “Formulation of model”, the formulation of a FF-order mathematical model using the Mittag–Leffler kernel is introduced. “Existence and uniqueness” analyzes the proposed model, showing the existence and uniqueness of the solution through fixed point theory. In “Ulam–Hyers stability”, we investigate the Ulam–Hyers Stability. “Chaos Control” focuses on controlling chaos. In “PID and controllability”, we evaluate PID and Controllability. “Numerical scheme” contains the numerical analysis of the model. In “Results of proposed scheme”, numerical simulations and graphical results for the examined system are provided, employing the Newton polynomial method. Finally, “Conclusion” wraps up our findings.
Basic concepts
Here, we provide some key definitions that may help improve system analysis.
Definition 2.1
32 The fractal-fractional derivative of order  for a fractal differentiable and continuous function
  on the interval (a, b) can be formulated in terms of the Riemann–Liouville derivative when
  .
.
| 1 |
Where  . And
. And 
| 2 |
where  , and
, and  .
.
| 3 |
Here,  ,
,  represents the Mittag-Leffler function, and
  denotes a normalization function.
Definition 2.2
8 A continuous function  on (a, b) has a fractional order
  and a fractal dimension
  when
when  .
.
| 4 |
| 5 |
| 6 |
Formulation of model
The dynamics of  -cell
-cell  glucose (G), insulin (I), and glucagon (J) are the main emphasis of the diabetes model incorporating parameters
  ,I,G, and J are study in31. The model captures the interplay between
  -cells, insulin, glucose, and glucagon in regulating blood sugar levels. Parameters like
  , d and e determine how effectively glucose is regulated. The balance between insulin activity
  , glucagon production p, and therapy b influences whether the system remains in a healthy state or progresses toward diabetes. Understanding these parameters helps in developing targeted treatments for diabetes management. The parameters values are shown in Table 1.
Table 1.
Model parameters and their biological relevance.
| Symbols | Description of model parameters31 | Values |
|---|---|---|
 |
Recruiting rate | 0.05 |
 |
Natural death rate | 0.01 |
| l | Rate of Loss due to constraint susceptibility | 1 |
| e | Pace of glucose imbalance development | 0.4 |
| b | Therapy rate | 0.07 |
 |
Interaction rate | 0.6 |
 |
Insulin activity rate | 0.6 |
| d | Insulin degradation rate | 0.6 |
| p | Basal production rate of J | 0.3 |
The Mittag–Leffler kernel is a generalization of the exponential function, commonly used in fractional calculus to describe processes with memory and hereditary properties. It provides a flexible framework for modeling systems where the effects of past states gradually diminish over time, unlike the constant decay in classical models. Fractal fractional operators combine fractional calculus with fractal geometry, extending the concept of differentiation and integration to account for dynamics on irregular or self-similar geometries. These operators are particularly useful in capturing the complexity of biological systems, such as glucose-insulin regulation, where memory effects and heterogeneous interactions play a significant role.
This diabetes model provides a comprehensive framework for understanding and managing glucose-insulin dynamics through advanced fractional techniques.
 |
7 |
in terms of the initial conditions
Positively invariant region
We demonstrate the enclosed or closed set in this section.
| 8 |
The region derived from the closed set, which serves as the system (7) feasibility region and guarantees positive invariance, is displayed in this section.
Lemma 1
The region

| 9 |
It draws all solutions from the system (7) and maintains positive invariance, given non-negative initial conditions within the proposed system in
 .
.
Proof
Here are the outcomes of our depiction of the system’s (7) positive solutions:
 |
10 |
The vector field stays inside the region  along each hyperplane containing the non-negative orthant for
  , according to the system (10). Therefore, we can say that the area
  ,
,
constitutes a region that maintains positive invariance. 
Equilibrium point analysis
The equilibrium point for the proposed model is as follows:
| 11 |
Existence and uniqueness
In this section, we elucidate the existence and uniqueness of the solution for the proposed model through the application of the fixed-point methodology.
 |
12 |
Expression reformulated using Fractal-Fractional integral and Mittag–Leffler kernel.
 |
13 |
We show that  , the principal elements of the governing equations (13), operate as contraction maps. Moreover,
  functions as continuous compact integral component parts. The fixed point theorem of Krasnoselski is used for these validations.
 |
14 |
Theorem 4.1
The transformation
 is nonlinear. When
 , as stated in equation (13), guarantees a Lipschitz contractive condition.
Proof
A completely normed space contains the definition of the operator  . The norm here denotes
| 15 |
(i) First, we shall show that  functions as a contraction map. Taking into account
  and
and  , we find that
 |
16 |
 where
where 
Similarly for (I, G, J),
 where
where 
 where
where 
 where
where 
This indicates that in the case of the operator  , we observe
 |
17 |
where  . With
  being a Lipschitz constant, it follows that
  represents a non-expansive operator.
To prove  is Continuously compact:
We will demonstrate the continuity and compactness of  . The absolute value of all positively bounded continuous operators
  specified in equations (13), indicated by non-zero positive constants
  ,
,  , satisfying certain boundedness conditions, confirm the compactness of the operator
  .
.
 |
18 |
If we consider  to be a closed subset of
  , then
| 19 |
When  , we get
 |
20 |
where  . In this manner, we have
 |
For the other compartments in the suggested model, we use a similar method to determine that the maximal norm of  is:
is:
| 21 |
We prove that  , where
  is a positive constant. This suggests that
  is a uniformly bounded operator.
Next, we will demonstrate the equi-continuity of  for
for  . To achieve this, for
  , we have
| 22 |
Likewise, in a similar manner
| 23 |
Given that  is unrelated to
  , this infers that
| 24 |
Consequently,  denotes an operator that is both totally continuous and equi-continuous.
  is comparatively compact according to Arzela’s theorem. According to Krasnoselski’s theorem, the operators
  and
and  guarantee the existence of a unique solution due to their contraction and continuity qualities.
Theorem 4.2
The model (7) possesses a unique solution if
where
 .
.
Proof
Define an operator  using Eq. (13) in the following manner:
Considering  and employing equation (20), we obtain
 when
when  . Hence
with
Continuing this method, we determine
Ulam–Hyers stability
 |
25 |
there exist  are satisfying
 |
26 |
such that
Similarly for other
 |
27 |
Theorem 5.1
The functions
 and
and
 are consistent under certain conditions
| 28 |
Ulam–Hyers stability for the fractional model (7) is achieved if a specific condition is satisfied.
Proof
A solution has been determined for  ,
,  ,
,  , and
, and  . Let
. Let  ,
,  ,
,  , and
, and  be approximate solutions that satisfy the specified conditions for the system.
| 29 |
consider  and
and  for
for 
| 30 |
similarly,
| 31 |
| 32 |
and
| 33 |
These contrasts demonstrate the system Ulam-Hyers stability. 
Thus, the connection of Ulam–Hyers stability to the proposed glucose-insulin model of fractional order is justified by the fact that this condition prevents major changes in the function behavior due to small perturbations in the control space. This property ensures that the model’s forecasts do not greatly fluctuate, or deviate in unpredicted ways, given uncertainties or changes in patient information. Thus, proving the Ulam-Hyers stability, the model can be confidently used for monitoring changes in glucose levels in real conditions and improving its use in clinical practice for diabetic patients.
Chaos control
In this section, we use the linear feedback control method to stabilize system (7) to equilibrium points. The fractional-order system in its controlled form (7) will be analyzed as follows:
| 34 |
where  (7) is the system equilibrium point and the control variables are
  ,
,  ,
,  , and
, and  . For the system (34), the Jacobian matrix at
  is built as
 is the selection. The typical roots of the polynomial with respect to the equilibrium point
  are as follows.
| 35 |
Moreover,  ,
,  ,
,  , and
, and  are computed as the characteristic roots of Eq. (35). Given that each of the eigenvalues is a negative real number,
  is an asymptotically stable equilibrium point. Surface phase plots in 3D at different fractional order values of the GIG model derived in Figs. 1 and 2 at different initial conditions show the results in feasible control. We can easily observe the effect of the relation of beta cells and glucagon effect on glucose-insulin compartments to manage the glucose level in the human body.
Fig. 1.

GIG Surface phase plot at different fractional order values in feasible control.
Fig. 2.

GIG Surface phase plot at different fractional order and initial values in feasible control.
Chaotic behavior in diabetes dynamics suggests unpredictable fluctuations in glucose and insulin levels, complicating disease management. This highlights the need for robust, adaptive therapeutic strategies like real-time glucose monitoring and dynamic insulin delivery systems. Understanding chaos improves prediction models, aiding in early detection of destabilizing patterns. These insights pave the way for personalized and precision-based interventions to optimize patient outcomes.
PID and controllability
The diabetic mathematical model is provided as
 |
36 |
In this study, we use the Mittag–Leffler kernel to build a fractal-fractional model for diabetes. The following is a description of this model:
 |
37 |
where  .
.
Fractional-order PID controller33 is as follows:
 |
38 |
where  ,
,  and
and  and
and  and
and  are the control gains.
The system controller (38) includes proportional, integral, and derivative components governed by gains  ,
,  , and
, and  . It simplifies to a fractional PD controller when
  , a fractional PI controller when
  , and a conventional PID controller for
  .
.
Applying controller (38) to model (37) yields the following controlled model:
| 39 |
Declare the recently added variables.
 |
As thus, the fractional-order controlled model (39) can be expressed as
| 40 |
 |
Analyzing the controlled model (39) is challenging due to integral variable terms in the controller (38). To simplify, variable transformation is applied, yielding the corresponding-order model (40) for easier analysis.
The controlled model (40) has a unique positive equilibrium, where the first components  ,
,  ,
,  , and
, and  match the equilibrium of the uncontrolled model (38). This shows the fractional-order PID controller (39) effectively preserves the original model unique equilibrium.
Numerical scheme
In this part, we numerically solve the system (7) using the Newton polynomial.
 |
41 |
To make things simple, we could describe the system mentioned above as follows:
 |
42 |
Using the Mittag–Leffler kernel and the fractal-fractional integral, we get the following:
| 43 |
| 44 |
| 45 |
| 46 |
Here, the Newton polynomial is reviewed:
| 47 |
The Newton polynomial (47) can be used to solve equations (43)–(46). This provides us with
 |
48 |
 |
49 |
 |
50 |
 |
51 |
we get
 |
52 |
 |
53 |
 |
54 |
 |
55 |
where
 |
56 |
The flowchart shown in Fig. 3 represents a complete scenario for the numerical technique used in this paper.
Fig. 3.
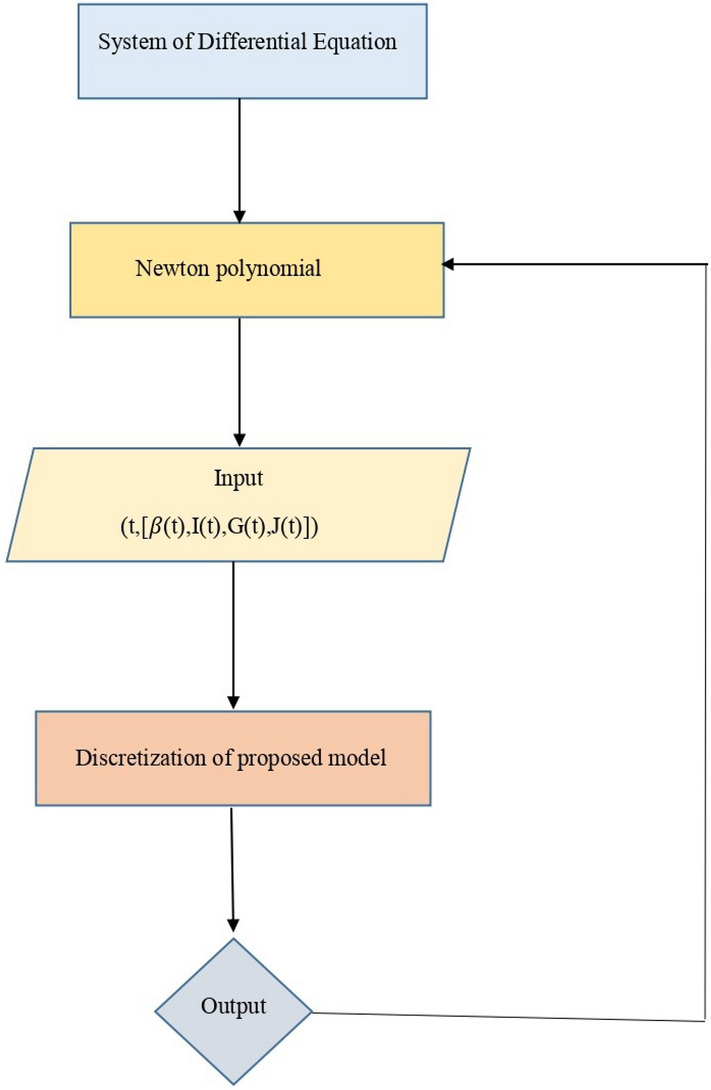
The proposed work flowchart.
Results of proposed scheme
This section discusses the numerical simulation of the suggested approach for the diabetes model using the Mittage–Leffler kernel. The system parameter values and initial conditions are explained in31 where  ,
,  l=1, e=0.4, b=0.07, p=0.3,
  ,
,  and d=0.6. Using novel techniques, the efficacy of the theoretical results provided is verified. Figures 4, 5, 6, 7, 8, 9, 10 and 11 display solutions for each compartment at a fixed fractal dimension of the system with varying fractional order values. Matlab coding is used to find the numerical simulation for the fractional-order diabetes model. For every component of the model, distinct fractional order differentiation is used, as indicated by the fractional order
  and fractal dimension
  . Higher values indicate larger memory effects, which are typical of biological systems with complicated, delayed reactions. These values also affect how the dynamics change with time.
Fig. 4.

Simulation of  with different fractional order.
Fig. 5.

Simulation of I(t) with different fractional order.
Fig. 6.

Simulation of G(t) with different fractional order.
Fig. 7.

Simulation of J(t) with different fractional order.
Fig. 8.

Simulation of  at fractal 0.1 and different initial and fractional values.
Fig. 9.

Simulation of I(t) at fractal 0.1 and different initial and fractional values.
Fig. 10.

Simulation of G(t) at fractal 0.1 and different initial and fractional values.
Fig. 11.

Simulation of J(t) at fractal 0.1 and different initial and fractional values.
In Fig. 4a increase  stabilizes beta cells quickly, reflecting efficient insulin secretion, while decrease fractional orders causes slower response, indicating dysfunction.
  dynamics take longer to stabilize with increased oscillations in Fig. 4b, modeling weaker glucose regulation seen in diabetes. Figure 5a when increase
  ensures rapid insulin response and decay, mimicking healthy regulation. Insulin stabilization Fig. 5b takes longer with prolonged peaks when decrease fractional orders, modeling impaired pancreatic response. Increase in fractional order ensures quick glucose stabilization Fig. 6a, reflecting normal uptake. Glucose stabilization Fig. 6b is slower with significant oscillations at low
  , suggesting weak compensatory mechanisms. In Fig. 7a, when increase in fractional order leads to efficient glucagon regulation, supporting glucose balance. Delayed stabilization and oscillatory behavior across
  indicate inefficient glucagon control in Fig. 7b, worsening glucose imbalance. In Fig. 8a lead to faster stabilization and stronger beta cell dynamics, modeling efficient beta cell function. Figure 8b delay stabilization, reflecting reduced beta cell activity. Increase response speed but with minor oscillations Fig. 8c, simulating robust beta cell recovery. Figure 9a ensure faster stabilization, representing efficient insulin release and regulation. Figure 9b delayed stabilization and reduced peaks, simulating weakened insulin secretion. Figure 9c stabilize quickly, with minimal oscillations, reflecting strong regulatory feedback. Figure 10a stabilize quickly with minimal oscillations, simulating effective glucose uptake. Figure 10b delayed stabilization with fluctuations, representing inefficient glucose control. Figure 10c stabilize rapidly but show minor oscillations, modeling robust glucose uptake mechanisms. Figure 11a stabilize efficiently, ensuring effective glucose mobilization. Figure 11b lead to prolonged stabilization, reflecting weak regulation. Figure 11c stabilize quickly with minimal fluctuations, representing strong compensatory mechanisms. In Figs. 8, 9, 10 and 11) Higher
  values enhance glucagon stabilization, ensuring efficient glucose regulation during fasting. Efficient glucagon stabilization reflects proper metabolic balance. Delays and oscillations mimic glucagon dysregulation, contributing to hyperglycemia. Variations in fractional orders significantly influenced the dynamics of the model. Higher orders
  resulted in faster stabilization and minimal oscillations, which reflect efficient glucose-insulin regulation. In contrast, lower orders
  led to delayed stabilization and pronounced oscillations, mimicking pathological states such as insulin resistance and glucagon dysregulation. These findings highlight the fractional-order model’s capability to capture the complexities of real-world diseases, offering insights into both normal and abnormal glucose homeostasis. Clinically, such models could enhance personalized diabetes management by tailoring interventions based on specific fractional parameters. Notable trends include faster stabilization and smoother dynamics observed at higher fractional orders, which indicate healthy regulation. Conversely, lower orders exhibited oscillations that mirrored diabetes-related dysfunctions. Unexpectedly, these lower orders also amplified delays, providing insights into glucagon dysregulation and hyperglycemia. Overall, the fractional-order model demonstrates superior performance compared to traditional integer-order models by capturing memory effects, leading to faster stabilization and reduced oscillations for
  -cells, insulin, glucose, and glucagon. Integer-order models fail to replicate the delayed responses and oscillatory behavior typical of pathological states, which limits their clinical applicability. The flexibility of fractional orders allows for more accurate simulations of diabetes dynamics, enabling better predictive insights and the potential for personalized treatment strategies. The impact of fractional orders on proposed model, highlighting memory effects in diabetes regulation. Lower fractional orders result in smoother, delayed responses, capturing long-term biological dependencies that integer-order models fail to represent. These results align with real-world observations where glucose and insulin exhibit history-dependent behaviors, crucial in diabetes progression and treatment strategies. The fractional approach provides a more accurate representation of metabolic processes, offering insights for personalized diabetes management. The fractal-fractional approach with Mittag–Leffler kernels provides a more flexible and accurate model of diabetes dynamics by capturing memory and delayed responses inherent in biological systems, which traditional integer-order models miss. This approach allows for better simulation of long-term disease progression and varied therapeutic effects. Consequently, it offers insights into both chronic and acute phases of diabetes, enhancing predictive accuracy for management and intervention strategies.
Conclusion
This study presents a novel mathematical model that combines the Mittag–Leffler kernel and fractional fractals. The diabetes model study aims to provide a sophisticated framework for understanding disease dynamics through advanced mathematical modeling techniques, ultimately contributing to better management strategies for diabetes and its complications. Chaos control and PID controllability in diabetes modeling help stabilize erratic glucose levels, ensuring a steady response to treatment. The use of the fractal fractional operator in diabetes modeling enhances the accuracy and reliability of predictions by better capturing the complexities of biological interactions, ensuring solution uniqueness, and providing flexible modeling capabilities that adapt to individual patient needs. A diabetes model using the fractal-fractional Mittag–Leffler function could contribute to future healthcare by enhancing predictive accuracy in glucose-insulin interactions, enabling more personalized treatment approaches. This model could also inform early intervention strategies by identifying irregular patterns that signal diabetes progression, ultimately supporting better long-term management and prevention. The fractional-order models for glucose-insulin monitoring arise from the complexity of Mittag–Leffler functions and fractal-fractional derivatives, which demand high computational resources. Implementing numerical methods like Newton polynomials adds to this expense due to iterative calculations. Efficient algorithms and parallel computing can mitigate these challenges. The study demonstrates the effectiveness of fractional-order modeling and PID control in stabilizing chaotic glucose-insulin dynamics, improving accuracy and system controllability. While the model offers significant insights, its reliance on idealized parameters may limit real-world applicability. Future research should focus on refining the model by incorporating real-world data to validate and adjust the parameters, enhancing its applicability in clinical settings. Additionally, exploring the integration of machine learning techniques could provide adaptive modeling capabilities, allowing for real-time adjustments based on individual patient responses. Investigating the impact of various lifestyle factors, such as diet and exercise, on glucose dynamics within the model could further improve its predictive power.
Acknowledgements
The authors extend their appreciation to Prince Sattam bin Abdulaziz University for funding this research work through the project number (PSAU/2024/01/31198).
Author contributions
Conceptualization: M.F., K.S.N.; Formal analysis: K.S.N.; Investigation: M.F., K.S.N.; Methodology: K.S.N.; Software: M.F., K.S.N.; Validation: K.S.N.; Writing—original draft: M.F., K.S.N.
Funding
The authors extend their appreciation to Prince Sattam bin Abdulaziz University for funding this research work through the project number (PSAU/2024/01/31198).
Data availability
The datasets analyzed during the current study are available from the corresponding author upon reasonable request.
Declarations
Competing interests
The authors declare no competing interests.
Footnotes
Publisher’s note
Springer Nature remains neutral with regard to jurisdictional claims in published maps and institutional affiliations.
References
- 1.Zheng, Y., Ley, S. H. & Hu, F. B. Global aetiology and epidemiology of type 2 diabetes mellitus and its complications. Nat. Rev. Endocrinol.14(2), 88–98 (2018). [DOI] [PubMed] [Google Scholar]
- 2.Lin, X. et al. Global, regional, and national burden and trend of diabetes in 195 countries and territories: an analysis from 1990 to 2025. Sci. Rep.10(1), 1–11 (2020). [DOI] [PMC free article] [PubMed] [Google Scholar]
- 3.Saeedi, P. et al. Global and regional diabetes prevalence estimates for 2019 and projections for 2030 and 2045: Results from the International Diabetes Federation Diabetes Atlas. Diabetes Res. Clin. Pract.157, 107843 (2019). [DOI] [PubMed]
- 4.Kharroubi, A. T. & Darwish, H. M. Diabetes mellitus: The epidemic of the century. World J. Diabetes6(6), 850 (2015). [DOI] [PMC free article] [PubMed] [Google Scholar]
- 5.Abduljabbar, M. H., Alhawsawi, G. A., Aldharman, S. S., Alshahrani, K. I., Alshehri, R. A., Alshehri, A. A., et al. Persistence of symptoms following infection with COVID-19 among patients with type 1 and type 2 diabetes mellitus in Saudi Arabia. Cureus. 15(8) (2023). [DOI] [PMC free article] [PubMed]
- 6.Zhu, L. et al. Association of blood glucose control and outcomes in patients with COVID-19 and pre-existing type 2 diabetes. Cell Metab.31(6), 1068–1077 (2020). [DOI] [PMC free article] [PubMed]
- 7.Apicella, M. et al. COVID-19 in people with diabetes: understanding the reasons for worse outcomes. Lancet Diabetes Endocrinol.8(9), 782–792 (2020). [DOI] [PMC free article] [PubMed] [Google Scholar]
- 8.Atangana, A. Mathematical model of survival of fractional calculus, critics and their impact: How singular is our world?. Adv. Differ. Equ.2021(1), 403 (2021). [Google Scholar]
- 9.Xu, C. et al. Lyapunov stability and wave analysis of Covid-19 omicron variant of real data with fractional operator. Alex. Eng. J.61(12), 11787–11802 (2022). [Google Scholar]
- 10.Farman, M. et al. Fractal-fractional operator for COVID-19 (Omicron) variant outbreak with analysis and modeling. Results Phys.39, 105630 (2022). [DOI] [PMC free article] [PubMed] [Google Scholar]
- 11.Jamil, S., Naik, P. A., Farman, M., Saleem, M. U., & Ganie, A. H. Stability and complex dynamical analysis of COVID-19 epidemic model with non-singular kernel of Mittag–Leffler law. J. Appl. Math. Comput.. 1-36 (2024).
- 12.Farman, M. et al. Numerical study and dynamics analysis of diabetes mellitus with co-infection of COVID-19 virus by using fractal fractional operator. Sci. Rep.14(1), 16489 (2024). [DOI] [PMC free article] [PubMed] [Google Scholar]
- 13.Wang, Y. & Liu, L. Uniqueness and existence of positive solutions for the fractional integro-differential equation. Bound. Value Probl.2017, 1–17 (2017). [Google Scholar]
- 14.Wang, Y. & Jiang, J. Existence and nonexistence of positive solutions for the fractional coupled system involving generalized p-Laplacian. Adv. Differ. Equ.2017, 1–19 (2017). [Google Scholar]
- 15.Shi, S. & Xiao, J. Fractional capacities relative to bounded open Lipschitz sets complemented. Calc. Var. Partial. Differ. Equ.56(1), 3 (2017). [Google Scholar]
- 16.Wang, K. L. New analysis methods for the coupled fractional nonlinear Hirota equation. Fractals31(09), 2350119 (2023). [Google Scholar]
- 17.Wang, K. New computational approaches to the fractional coupled nonlinear Helmholtz equation. Eng. Comput.. (2024).
- 18.Shi, S. & Xiao, J. A tracing of the fractional temperature field. Sci. China Math.60, 2303–2320 (2017). [Google Scholar]
- 19.Kuang, N. & Xie, H. Asymptotic behavior of weighted cubic variation of sub-fractional Brownian motion. Commun. Stat.-Simul. Comput.46(1), 215–229 (2017). [Google Scholar]
- 20.Wang, K. L. An efficient scheme for two different types of fractional evolution equations. Fractals32(05), 2450093 (2024). [Google Scholar]
- 21.Wang, K. L., & Wei, C. F. (2024). novel optical soliton solutions of the fractional perturbed Schrödinger equation in optical fiber. Fractals. 2450147.
- 22.Naik, P. A. et al. Modeling and analysis using piecewise hybrid fractional operator in time scale measure for ebola virus epidemics under Mittag–Leffler kernel. Sci. Rep.14(1), 24963 (2024). [DOI] [PMC free article] [PubMed] [Google Scholar]
- 23.Aldwoah, K. A. et al. Mathematical analysis and numerical simulations of the piecewise dynamics model of Malaria transmission: A case study in Yemen. AIMS Math.9(2), 4376–4408 (2024). [Google Scholar]
- 24.Alraqad, T. et al. Modeling ebola dynamics with a F-piecewise hybrid fractional derivative approach. Fractal Fract.8(10), 596 (2024). [Google Scholar]
- 25.Aldwoah, K. A., Almalahi, M. A. & Shah, K. Theoretical and numerical simulations on the hepatitis B virus model through a piecewise fractional order. Fractal Fract.7(12), 844 (2023). [Google Scholar]
- 26.Aldwoah, K. A., Almalahi, M. A., Shah, K., Awadalla, M. & Egami, R. H. Dynamics analysis of dengue fever model with harmonic mean type under fractal-fractional derivative. AIMS Math.9(6), 13894–13926 (2024). [Google Scholar]
- 27.Farman, M., Jamil, K., Xu, C., Nisar, K. S. & Amjad, A. Fractional order forestry resource conservation model featuring chaos control and simulations for toxin activity and human-caused fire through modified ABC operator. Math. Comput. Simul.227, 282–302 (2025). [Google Scholar]
- 28.Xu, C., Farman, M., Shehzad, A., & Sooppy Nisar, K. Modeling and Ulam–Hyers stability analysis of oleic acid epoxidation by using a fractional-order kinetic model. Math. Methods Appl. Sci.
- 29.Farman, M., Hasan, A., Xu, C., Nisar, K. S. & Hincal, E. Computational techniques to monitoring fractional order type-1 diabetes mellitus model for feedback design of artificial pancreas. Comput. Methods Progr. Biomed.257, 108420 (2024). [DOI] [PubMed] [Google Scholar]
- 30.Batool, M., Farman, M., Ghaffari, A. S., Nisar, K. S., & Munjam, S. R. Analysis and dynamical structure of glucose insulin glucagon system with Mittage–Leffler kernel for type I diabetes mellitus. Sci. Rep.. 14(1), 8058. 1218-1237 (2024). [DOI] [PMC free article] [PubMed]
- 31.Ali, H.A., Alireza, D., Abdesslam, B., Zindoga, M. Examining type 1 diabetes mathematical models using experimental data. IJERPH. 19(2), 1 (2022). [DOI] [PMC free article] [PubMed]
- 32.Xu, C. et al. Insights into COVID-19 stochastic modelling with effects of various transmission rates: simulations with real statistical data from UK, Australia, Spain, and India. Phys. Scr.99(2), 025218 (2024). [Google Scholar]
- 33.Nisar, K. S., Farman, M., Jamil, K., Jamil, S. & Hincal, E. Fractional-order PID feedback synthesis controller including some external influences on insulin and glucose monitoring. Alex. Eng. J.113, 60–73 (2025). [Google Scholar]
Associated Data
This section collects any data citations, data availability statements, or supplementary materials included in this article.
Data Availability Statement
The datasets analyzed during the current study are available from the corresponding author upon reasonable request.