

Abstract
Oxide and silicate frameworks, known for their structural adaptability, play a pivotal role in gas storage, drug delivery, electronics, and catalysis. In this study, we explore the structural complexities of silicate and oxide networks through the lens of chemical graph theory, focusing on their molecular topology and its implications for real-world applications. By representing these materials as molecular graphs—where atoms are represented by vertices, and edges depict bonds—we employ various Revan topological indices namely, first Revan index, second Revan index, third Revan index, first modified Revan index, second modified Revan index, the first hyper Revan index, second hyper Revan index, sum connectivity Revan index, product connectivity Revan index, harmonic Revan index, geometric arithmetic Revan index, arithmetic geometric Revan index, F-Revan index, and Sombor Revan index for chain silicates, chain oxide frameworks, sheet oxide frameworks, and sheet silicate frameworks to quantitatively assess their structural and physicochemical properties. Through graphical and numerical analyses, this study offers new insights into the structure–property relationships of these networks. Our work opens the door for more efficient application of these materials across industries, particularly in nanotechnology, environmental remediation, and material science, where understanding topological features is critical to enhancing performance. The results also contribute to a deeper understanding of chemical networks, advancing both theoretical knowledge and practical applications in chemistry and material science.
Keywords: Graph theory, Revan topological indices, Silicate and oxide network
Subject terms: Theoretical chemistry, Computational chemistry, Structure prediction, Applied mathematics
Introduction
The study of graphs that focused on the connection between networks of points and lines is known as graph theory. Graph theory finds numerous real-world applications in fields such as computer graphics, networking, biology, and various other domains. Molecular graph theory, a specialized branch, utilizes discrete mathematics to analyze and model the physical and biological properties of chemical compounds. Leonhard Euler1 was Swiss mathematician who introduced graph theory in eighteenth century.
Networks link nodes that are connected to each other in some way. A network is made up of several individual PCs that are linked together. A network can also be considered to be formed by cell phone users. Examining the optimal approach to network implementation is a step in the networking process. A new field of study called “cheminformatics” combines information science, mathematics, and chemistry. It attracted the interest of researchers worldwide.
Silicates make up the majority of minerals found in the crust of the Earth. In the majority of commonly found silicates, which include practically all silicate minerals found in Earth’s crust. Metal carbonates or oxides from sand can be combined to create silicates. By combining distinct tetrahedron silicates, we can obtain a variety of silicate structures. In a similar vein, distinct silicate structures construct silicate networks. The oxide networks are produced by taking silicon atoms out of the tetrahedra’s center. The copper II oxide (cupric oxide) network is also taken into consideration here. In medical science, copper is incredibly useful. It is necessary for the synthesis and stability of skin proteins in addition to containing powerful biocidal properties2. CuO is an inorganic chemical compound formed from copper II oxide, also known as cupric oxide. This mineral is essential to both plants and animals. Copper II oxide is a safe copper source that is used in vitamin and mineral supplements.
The properties of materials strongly depend on the molecular structure of materials. Therefore, it is very important to model and characterize the structure to predict and enhance the properties. A topological index is a numerical value that can be used to describe a certain feature of the molecular graph. Topological indices are used in theoretical chemistry to predict and evaluate the physical and biological characteristics of chemical compounds, including their boiling point, stability, enthalpy of vaporization, and other characteristics3–14. Many topological descriptors have been examined in theoretical chemistry and have found applications, particularly in QSPR/QSAR research15–24. Topological indices are categorized into three types which are as under: Degree based topological descriptors, distance based topological descriptors, and counting related polynomials indices25–29. Degree based topological descriptors play an important role in molecular graph theory particularly in chemistry7,30–37. The references listed in18,30,33,38–48 have utilized several novel topological descriptors for quantification of molecular structures. This research examines various silicate and oxide networks through Revan topological indices.
Let  be a connected graph with the vertex set
  and edge set
  . The degree of a vertex
  given by
  is the number of vertices adjacent at
  . The maximum and minimum degree of a graph
  is given as
  and
and  , respectively. The Revan vertex degree of a vertex
  is defined as
  +
+  . The edge
  denotes the Revan edge connecting the Revan vertices
  and
and  . One can consult refs.49–51 for more details about these topological indices.
The 1st, 2nd and 3rd Revan indices52–54 of  are expressed as follows:
| 1 |
| 2 |
| 3 |
The 1st and 2nd modified Revan indices55,56 of  are expressed as follows:
| 4 |
| 5 |
The 1st and 2nd hyper-Revan indices57,58 of  are described as follows:
| 6 |
| 7 |
Sum connectivity Revan index59 of  are expressed as follows:
| 8 |
Product connectivity Revan index60 of  is expressed as follows:
| 9 |
Harmonic Revan index61 of  are defined as follows:
| 10 |
Geometric arithmetic Revan index62 of  is defined as follows:
| 11 |
Arithmetic geometric Revan index63 of  is described as follows:
| 12 |
F-Revan index64 of  is expressed as follows:
| 13 |
Sombor Revan index65 of  is defined as follows:
| 14 |
In this study, first Revan index  second Revan index
  , third Revan index
  , first modified Revan index
  , second modified Revan index
  , The first hyper-Revan index
  , second hyper-Revan index
  , sum connectivity Revan index
  , product connectivity Revan index
  , harmonic Revan index
  , geometric arithmetic Revan index
  , arithmetic geometric Revan index
  , F-Revan index
  , and Sombor Revan index
  are computed for chain silicate and chain oxide networks. For more details regarding network modeling, the reader is referred to the works18,66–71.
Main results
Metal carbonates or oxides from sand can be combined to create silicates. By combining distinct tetrahedron silicates, we can obtain a variety of silicate structures. In a similar vein, distinct silicate structures construct silicate networks. The oxide networks are produced by taking silicon atoms out of the tetrahedra’s center. The copper II oxide (cupric oxide) network is also taken into consideration here72.
This section presents the main results for different types of Revan topological indices for the graphs of oxide and silicate chain networks  .
.
Results for the graph of chain oxide network 
The graph of chain oxide is shown in Fig. 1. We partition the edges of the graph with respect to the degree of the end vertices. All vertices containing degrees according to edges connected with the respective vertices are computed as 2 and 4. Here we have three different kinds of edges whose end vertices have degree (2, 2), (2, 4) and (4, 4). Symbolically represented by  ,
,  and
and  . Total number of edges calculated of the type
  ,
,  and
and  are 2, 2n and n − 2 respectively. Table 1 provides a summary of all these findings.
Fig. 1.

Chain oxide network.
Table 1.
Edge partition of chain oxide network based on the degree of end vertices of each edge.
 where where 
|
No. of edges |

|

|

|

|

|
|---|---|---|---|---|---|---|
|
2 | 2 | 2 | 4 | 4 |

|

|
2n | 2 | 4 | 4 | 2 |

|

|
n − 2 | 4 | 4 | 2 | 2 |

|
Theorem 1
Let
 is the graph of chain oxide network, then we have
 |
Proof
By using the edge partitions mentioned in Table 1 and Eqs. (1–14), we can obtain the results as follows.
 |
 |
 |

Results for the graph of chain silicate network 
The graph of chain silicate is shown in Fig. 2. The edge partition of the graph is performed according to the degree of the end vertices. All vertices with degrees according to edges connected with the respective vertices are computed as 3 and 6. Here we have three different types of edges whose end vertices have degree (3, 3), (3, 6) and (6, 6). Symbolically represented by  ,
,  and
and  . Total edge number calculated of the type
  ,
,  and
and  are
are  ,
,  and
and  respectively. All these results are summarized in Table 2.
Fig. 2.

Chain silicate network.
Table 2.
Partition of edges of chain silicate network based on the degree of end vertices of each edge.
 where where 
|
No. of edges |

|

|

|

|

|
|---|---|---|---|---|---|---|
|

|
3 | 3 | 6 | 6 |

|

|

|
3 | 6 | 6 | 3 |

|

|

|
6 | 6 | 3 | 3 |

|
Theorem 2
Let
 is the chain silicate network, then
 |
Proof
By using the edge partitions mentioned in Table 2 and Eqs. (1–14), we can obtain the results as follows.

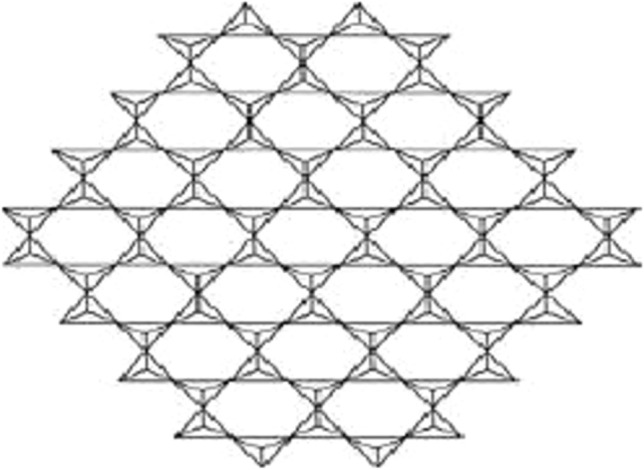
Results for the graph of sheet oxide network 
The graph of sheet oxide network is shown in Fig. 3. The edge partition of the graph is performed according to the degree of the end vertices. All vertices with degrees according to edges connected with the respective vertices are computed as 2 and 4. Here we have two different types of edges whose end vertices have degree (2, 4) and (4, 4). Symbolically represented by  and
and  . Total edge number calculated of the type
  and
and  are
are  and
and  respectively. All these results are summarized in Table 3.
Fig. 3.
Sheet oxide network.
Table 3.
Partition of edges of sheet oxide network based on the degree of end vertices of each edge.
 where where 
|
No. of edges |

|

|

|

|

|
|---|---|---|---|---|---|---|

|

|
2 | 4 | 4 | 2 |

|
|

|
4 | 4 | 2 | 2 |

|
Theorem 3
Let
 is the graph of sheet oxide network then
Proof
By using the edge partitions mentioned in Table 3 and Eqs. (1–14), we can obtain the results as follows
 |
 |
 |
 |
 |
 |
 |
 |

Results for the graph of sheet Silicate network 
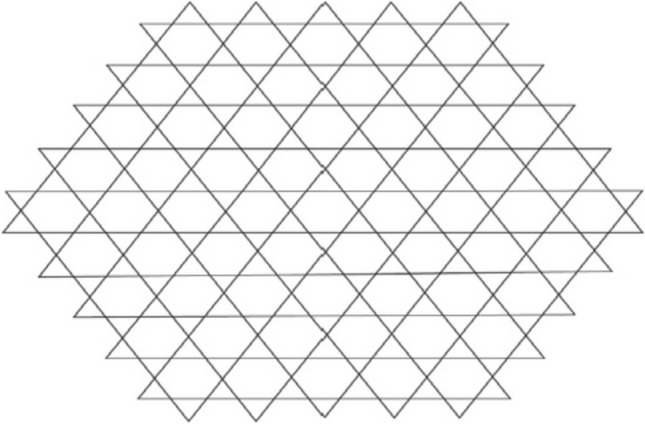
The graph of sheet silicate is shown in Fig. 4. The edge partition of the graph is performed according to the degree of the end vertices. All vertices having degrees according to edges connected with the respective vertices are computed as 3 and 6. Here we have three different types of edges whose end vertices have degree (3, 3), (3, 6) and (6, 6). Symbolically represented by  ,
,  and
and  . Total number of edges computed of the type
  ,
,  and
and  are
are  ,
,  and
and  respectively. All these results are summarized in Table 4.
Fig. 4.
Sheet silicate network.
Table 4.
Partition of edges of sheet silicate network based on the degree of end vertices of each edge.
 where where 
|
No. of edges |

|

|

|

|

|
|---|---|---|---|---|---|---|

|

|
3 | 3 | 6 | 6 |

|

|

|
3 | 6 | 6 | 3 |

|

|
|
6 | 6 | 3 | 3 |

|
Theorem 4
Let
 is the graph of sheet Silicate network then
Proof
By using the edge partitions mentioned in Table 4 and Eqs. (1–14), we can obtain the results as follows
 |
 |

Numerical results and chemical applicability of the Revan indices
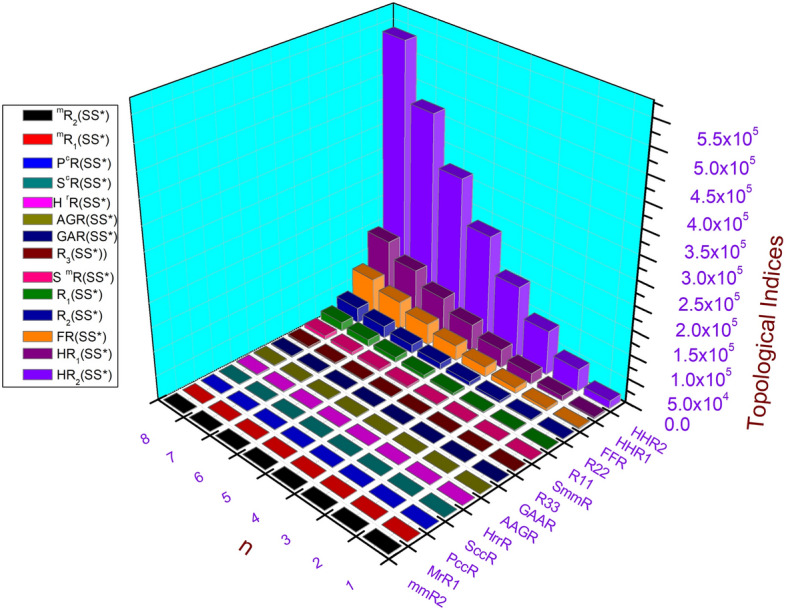
Numerical and graphical results of above computed topological indices for the graph of chain oxide network of dimension n, chain silicate network of dimension n, sheet oxide network and sheet silicate network are mentioned in Tables 5, 6, 7 and 8 and visualized in Figs. 5, 6, 7 and 8 respectively. Here, we observed that all indices for chain oxide network of dimension n, chain silicate network of dimension n, sheet oxide network and sheet silicate network increase for rising value of n. The increasing rate of  and
and  are higher than other topological indices. These computed topological indices have good correlations with many characteristics in network and chemistry. In order to test the chemical applicability and property prediction ability of the Revan topological indices, we have tested them against the experimental data of octane isomers.
Table 5.
Numerical comparison of Revan topological indices for different value of n in  .
.
| Topological indices |  |
 |
 |
 |
 |
 |
 |
 |
|---|---|---|---|---|---|---|---|---|
 |
24 | 40 | 56 | 72 | 88 | 104 | 120 | 136 |
 |
44 | 64 | 84 | 104 | 124 | 50 | 164 | 184 |
 |
4 | 8 | 12 | 16 | 20 | 24 | 28 | 32 |
 |
0.33333 | 0.91667 | 1.5 | 2.08333 | 2.66666 | 3.25 | 3.83333 | 4.41667 |
 |
0.125 | 0.625 | 1.125 | 1.625 | 2.125 | 2.625 | 3.125 | 3.625 |
 |
184 | 272 | 360 | 448 | 536 | 624 | 712 | 800 |
 |
624 | 768 | 912 | 1056 | 1200 | 1344 | 1488 | 1632 |
 |
1.02360 | 2.34009 | 2.65659 | 2.97309 | 3.28958 | 3.60608 | 3.92258 | 4.23907 |
 |
0.70710 | 1.914213 | 3.121320 | 4.328427 | 5.53553 | 6.74264 | 7.94974 | 9.15658 |
 |
0.91667 | 2.08333 | 3.25 | 4.41667 | 5.58333 | 6.75 | 7.91667 | 9.08333 |
 |
2.88561 | 5.77123 | 8.65685 | 11.5425 | 15.42802 | 17.3138 | 20.1993 | 23.0849 |
 |
3.62132 | 6.24264 | 8.86396 | 11.48528 | 14.10660 | 16.72792 | 19.34924 | 21.97056 |
 |
96 | 144 | 192 | 240 | 288 | 336 | 384 | 432 |
 |
17.42955 | 29.20225 | 40.97495 | 52.74765 | 64.52034 | 76.29304 | 88.06574 | 99.83844 |
Table 6.
Comparison of topological indices for different value of n in  .
.
| Topological indices |  |
 |
 |
 |
 |
 |
 |
 |
|---|---|---|---|---|---|---|---|---|
 |
72 | 116 | 180 | 234 | 288 | 342 | 396 | 450 |
 |
207 | 324 | 441 | 558 | 675 | 792 | 909 | 1026 |
 |
6 | 18 | 30 | 42 | 54 | 66 | 78 | 90 |
 |
0.16666 | 0.88889 | 1.58333 | 2.27778 | 2.97222 | 3.66667 | 4.36111 | 5.05556 |
 |
0.38889 | 0.5 | 0.53333 | 1.22222 | 1.58333 | 1.72222 | 2.30556 | 2.66667 |
 |
746 | 1250 | 1754 | 2258 | 2762 | 3266 | 3770 | 4274 |
 |
7047 | 9720 | 12,393 | 15,066 | 17,739 | 20,412 | 23,085 | 25,758 |
 |
1.94337 | 1.9318 | 5.52072 | 7.30940 | 9.09808 | 10.88675 | 12.67542 | 14.46410 |
 |
0.927140 | 2.41421 | 3.85702 | 5.29983 | 6.74264 | 8.185559 | 9.62825 | 11.07106 |
 |
3.40358 | 7.46410 | 11.52461 | 15.58512 | 19.64564 | 23.70615 | 27.76666 | 31.82718 |
 |
5.88561 | 11.65685 | 17.42809 | 2,319,932 | 28.97056 | 34.70615 | 40.51303 | 46.28427 |
 |
4.70701 | 9.53553 | 14.36396 | 19.19238 | 24.02081 | 28.84924 | 33.67766 | 38.50605 |
 |
432 | 702 | 972 | 1242 | 1512 | 1782 | 2052 | 2322 |
 |
51.60017 | 91.16091 | 130.7216 | 170.2823 | 209.8431 | 249.40386 | 288.96460 | 328.52533 |
Table 7.
Numerical comparison of topological indices for different value of n in  .
.
| Topological indices |  |
 |
 |
 |
 |
 |
 |
 |
|---|---|---|---|---|---|---|---|---|
 |
96 | 336 | 720 | 1248 | 1920 | 2736 | 3696 | 4800 |
 |
120 | 384 | 792 | 1344 | 2040 | 2880 | 3864 | 4992 |
 |
24 | 48 | 72 | 96 | 120 | 144 | 168 | 192 |
 |
3.5 | 16 | 37.5 | 68 | 107.5 | 156 | 213.5 | 280 |
 |
1 | 5 | 12 | 22 | 35 | 51 | 70 | 92 |
 |
528 | 1632 | 3312 | 5568 | 12,000 | 39,168 | 47,712 | 56,832 |
 |
864 | 2304 | 4320 | 6912 | 10,080 | 13,825 | 18,144 | 23,040 |
 |
7.8989 | 33.797 | 77.6969 | 139.595 | 219.494 | 317.39387 | 433.29285 | 567.1918 |
 |
7.2426 | 32.4852 | 75.727 | 136.970 | 216.21 | 313.45584 | 428.69848 | 561.94112 |
 |
7 | 34 | 75 | 136 | 215 | 312 | 427 | 560 |
 |
5.3137 | 46.6274 | 123.94112 | 237.254 | 386.5685 | 571.88225 | 793.19595 | 1050.50966 |
 |
18.727 | 73.4558 | 164.18376 | 290.911 | 453.6396 | 652.36753 | 887.0954 | 1157.82337 |
 |
0 | 288 | 864 | 1728 | 2880 | 4320 | 6048 | 8064 |
 |
70.636 | 243.095 | 517.37871 | 893.485 | 1341.414 | 1951.1678 | 2632.74426 | 3416.14409 |
Table 8.
Numerical comparison of Revan topological indices for different value of n in  .
.
| Topological indices |  |
 |
 |
 |
 |
 |
 |
 |
|---|---|---|---|---|---|---|---|---|
 |
324 | 1188 | 2592 | 4536 | 7020 | 10,044 | 13,608 | 17,712 |
 |
684 | 2304 | 4860 | 8352 | 12,780 | 18,144 | 24,444 | 31,680 |
 |
72 | 252 | 540 | 936 | 1440 | 2050 | 2772 | 3600 |
 |
4.83333 | 19.66667 | 44.5 | 79.33333 | 124.1666 | 179 | 243.8333 | 318.666 |
 |
2.5 | 11 | 25.5 | 46 | 72.5 | 105 | 143.5 | 188 |
 |
3024 | 10,260 | 21,708 | 37,368 | 57,240 | 81,324 | 109,620 | 142,128 |
 |
16,038 | 46,656 | 91,854 | 151,632 | 225,990 | 314,928 | 418,446 | 536,544 |
 |
13.674 | 54.04540 | 121.113 | 214.878 | 335.34055 | 482.49948 | 656.35534 | 856.90815 |
 |
8.65685 | 37.79898 | 87.42640 | 157.539 | 248.13708 | 359.22034 | 490.78888 | 642.84271 |
 |
34.363 | 142.1200 | 323.270 | 577.815 | 905.7541 | 1307.086 | 1781.81298 | 3129.933 |
 |
34.6274 | 139.19595 | 313.7056 | 558.156 | 872.54833 | 1256.8813 | 1711.15555 | 2235.3708 |
 |
34.4558 | 143.09545 | 325.9188 | 582.952 | 914.11688 | 1349.4915 | 1799.04999 | 2352.7922 |
 |
1620 | 5508 | 11,664 | 20,088 | 30,780 | 43,740 | 58,968 | 76,464 |
 |
160.996 | 563.48913 | 1207.476 | 2092.95 | 3219.937 | 4588.411 | 6198.3804 | 8049.844 |
Fig. 5.
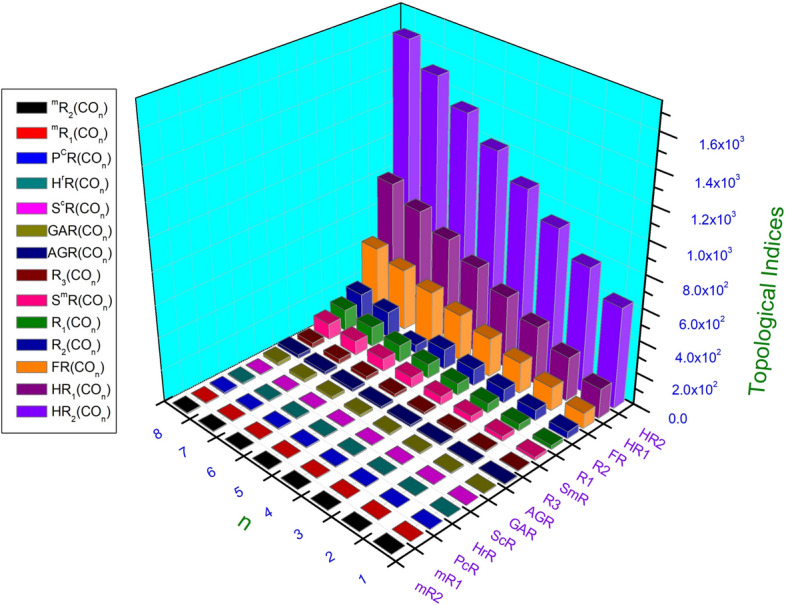
Graphical representation of Revan topological indices for  .
.
Fig. 6.
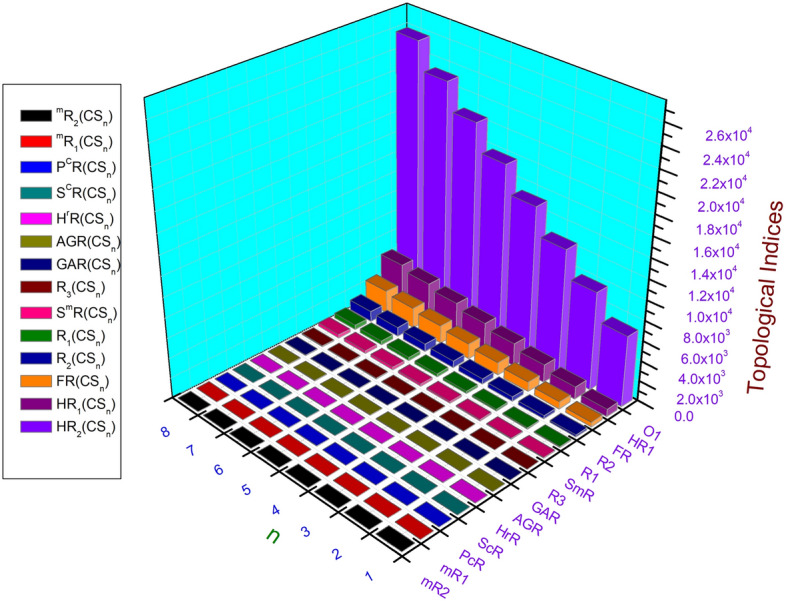
Graphical representation of Revan topological indices for  .
.
Fig. 7.

Graphical representation of Revan topological indices for  .
.
Fig. 8.
Graphical representation of Revan topological indices for  .
.
Following the guidelines set by the International Academy of Mathematical Chemistry (IAMC), regression analysis is employed to evaluate the applicability of topological indices in modeling physicochemical properties73. Octane isomers are often used for such analyses due to their structural diversity, which encompasses variations in branching and non-polar characteristics. These organic compounds provide an ideal test case because their numerous structural isomers allow for robust statistical evaluation, and comprehensive experimental data is readily accessible. According to Randić and Trinajstić74, theoretical invariants should be correlated with experimental physicochemical properties of octane isomers to assess their predictive capabilities19,75–77.
Here, the correlation of the 1st Revan index and second Revan index with entropy and the acentric factor was analyzed. Experimental data for the physicochemical properties of octane isomers were sourced from the IAMC-recommended database73, and its associated datasets78. Calculations were conducted following the methodology outlined in “Main results” section above. As illustrated in Figs. 9 and 10, both 1st and 2nd Revan indices demonstrated good correlation with the acentric factor (AF) and entropy (S). Among these two indices, the 1st Revan index has the highest correlation with both Acentric Factor and Entropy. This shows the potential chemical applicability of the considered topological indices.
Fig. 9.

Correlation of 1st Revan index with acentric factor and entropy for octane isomers.
Fig. 10.

Correlation of 2nd Revan index with acentric factor and entropy for octane isomers.
Conclusion
Topological indices help us understand the physical properties, biological activity, and chemical activity of a molecular structure. In this research we have computed degree based topological indices, namely, first Revan index, second Revan index, third Revan index, first modified Revan index, second modified Revan index, The first hyper- Revan index, second hyper- Revan index, sum connectivity Revan index, product connectivity Revan index, harmonic Revan index, geometric arithmetic Revan index, arithmetic geometric Revan index, F-Revan index, and Sombor Revan index for the graph of chain oxide network of dimension n, chain silicate network of dimension n, sheet oxide network and sheet silicate network. It can be observed from the obtained results that the first and second hyper Revan indices acquire higher values than other computed topological indices. These Revan type indices have good correlations with many properties in networking and Chemistry. The chemical applicability testing results of these indices show that, they have strong potential to predict important physico-chemical properties like Entropy and Acentric factor. Thus, the computed results can provide a good basis to understand the topology and properties of these graphs and networks in a better way. These findings may also have significant contributions in the field of chemical and materials sciences. For future research some other molecular structures can be considered for studying these Revan topological indices in order to test their robustness.
Acknowledgements
The authors extend their appreciation to Taif University, Saudi Arabia, project number (TU-DSPP-2024-47) for supporting this work.
Author contributions
All the authors Qun Zhang, Zubair Ahmad, Asad Ullah, Y. S. Hamed, Muzher Saleem and Melaku Berhe Belay have equally contributed to this manuscript in all stages, from conceptualization to the write-up of final draft.
Funding
This research was funded by Taif University, Saudi Arabia, Project No. (TU-DSPP-2024-47).
Data availability
All data generated or analyzed during this study are included in this article.
Declarations
Competing interests
The authors declare no competing interests.
Footnotes
Publisher’s note
Springer Nature remains neutral with regard to jurisdictional claims in published maps and institutional affiliations.
Qun Zhang and Zubair Ahmad contributed equally to this work.
Contributor Information
Asad Ullah, Email: dr.asadullah@kiu.edu.pk.
Melaku Berhe Belay, Email: melaku.berhe@aastu.edu.et.
References
- 1.Euler, L. Leonhard Euler and the Königsberg bridges. Sci. Am.189, 66–72 (1953). [Google Scholar]
- 2.Borkow, G. Safety of using copper oxide in medical devices and consumer products. Curr. Chem. Biol.6, 86–92 (2012). [Google Scholar]
- 3.Gutman, I. & Trinajstić, N. Graph theory and molecular orbitals. Total φ-electron energy of alternant hydrocarbons. Chem. Phys. Lett.17, 535–538 (1972). [Google Scholar]
- 4.Gutman, I. & Polansky, O. E. Mathematical Concepts in Organic Chemistry (Springer, 2012). [Google Scholar]
- 5.Todeschini, R. & Consonni, V. Molecular Descriptors for Chemoinformatics: Volume I: Alphabetical Listing/Volume II: Appendices, References (Wiley, 2009). [Google Scholar]
- 6.Zaman, S., Ullah, A., Naseer, R. & Rasool, K. B. Mathematical concepts and empirical study of neighborhood irregular topological indices of nanostructures TUC4C8 [p, q] and GTUC [p, q]. J. Math.2024, 7521699 (2024). [Google Scholar]
- 7.Ullah, A., Jabeen, S., Zaman, S., Hamraz, A. & Meherban, S. Predictive potential of K-Banhatti and Zagreb type molecular descriptors in structure–property relationship analysis of some novel drug molecules. J. Chin. Chem. Soc.71, 250–276 (2024). [Google Scholar]
- 8.Huang, Z. et al. Graph relearn network: Reducing performance variance and improving prediction accuracy of graph neural networks. Knowl. Based Syst.301, 112311 (2024). [Google Scholar]
- 9.Shi, X., Zhang, Y., Pujahari, A. & Mishra, S. K. When latent features meet side information: A preference relation based graph neural network for collaborative filtering. Expert Syst. Appl.260, 125423 (2025). [Google Scholar]
- 10.Yu, X., Zaman, S., Ullah, A., Saeedi, G. & Zhang, X. Matrix analysis of hexagonal model and its applications in global mean-first-passage time of random walks. IEEE Access11, 10045–10052 (2023). [Google Scholar]
- 11.Yan, T., Kosar, Z., Aslam, A., Zaman, S. & Ullah, A. Spectral techniques and mathematical aspects of K4 chain graph. Phys. Scr.98, 045222 (2023). [Google Scholar]
- 12.Kosar, Z., Zaman, S., Ali, W. & Ullah, A. The number of spanning trees in a K5 chain graph. Phys. Scr.98, 125239 (2023). [Google Scholar]
- 13.Hayat, S., Suhaili, N. & Jamil, H. Statistical significance of valency-based topological descriptors for correlating thermodynamic properties of benzenoid hydrocarbons with applications. Comput. Theor. Chem.1227, 114259 (2023). [Google Scholar]
- 14.Hayat, S., Khan, M. A., Khan, A., Jamil, H. & Malik, M. Y. H. Extremal hyper-Zagreb index of trees of given segments with applications to regression modeling in QSPR studies. Alex. Eng. J.80, 259–268 (2023). [Google Scholar]
- 15.Karelson, M. J. Molecular Descriptors in QSAR/QSPR (2000).
- 16.Baig, A. Q., Imran, M., Khalid, W. & Naeem, M. Molecular description of carbon graphite and crystal cubic carbon structures. Can. J. Chem.95, 674–686 (2017). [Google Scholar]
- 17.Rücker, G. & Rücker, C. On topological indices, boiling points, and cycloalkanes. J. Chem. Inf. Comput. Sci.39, 788–802 (1999). [Google Scholar]
- 18.Ullah, A., Jamal, M. & Zaman, S. Connection based novel AL topological descriptors and structural property of the zinc oxide metal organic frameworks. Phys. Scr.99, 055202 (2024). [Google Scholar]
- 19.Mondal, S., Dey, A., De, N. & Pal, A. QSPR analysis of some novel neighbourhood degree-based topological descriptors. Complex Intell. Syst.7, 977–996 (2021). [Google Scholar]
- 20.Basak, S. Use of graph invariants in quantitative structure-activity relationship studies. Croat. Chem. Acta89, 419–429 (2016). [Google Scholar]
- 21.Liu, J. B., Wang, X. & Cao, J. The coherence and properties analysis of balanced 2p-ary tree networks. IEEE Trans. Netw. Sci. Eng.11, 4719–4728 (2024). [Google Scholar]
- 22.Kirana, B., Shanmukha, M. C. & Usha, A. Comparative study of Sombor index and its various versions using regression models for top priority polycyclic aromatic hydrocarbons. Sci. Rep.14, 19841 (2024). [DOI] [PMC free article] [PubMed] [Google Scholar]
- 23.Shanmukha, M. C. et al. Chemical applicability and computation of K-Banhatti indices for benzenoid hydrocarbons and triazine-based covalent organic frameworks. Sci. Rep.13, 17743 (2023). [DOI] [PMC free article] [PubMed] [Google Scholar]
- 24.Shanmukha, M. C., Usha, A., Basavarajappa, N. S. & Shilpa, K. C. Comparative study of multilayered graphene using numerical descriptors through M-polynomial. Phys. Scr.98, 075205 (2023). [Google Scholar]
- 25.Gutman, I. Degree-based topological indices. Croat. Chem. Acta86, 351–361 (2013). [Google Scholar]
- 26.Raza, Z., Arockiaraj, M., Maaran, A., Kavitha, S. R. J. & Balasubramanian, K. Topological entropy characterization, NMR and ESR spectral patterns of coronene-based transition metal organic frameworks. ACS Omega10.1021/acsomega.3c00825 (2023). [DOI] [PMC free article] [PubMed] [Google Scholar]
- 27.Liu, J.-B., Zhang, X. & Cao, J. Structural properties of extended pseudo-fractal scale-free network with higher network efficiency. J. Complex Netw.12, cnae023 (2024). [Google Scholar]
- 28.Arockiaraj, M. et al. QSPR analysis of distance-based structural indices for drug compounds in tuberculosis treatment. Heliyon10, e23981 (2024). [DOI] [PMC free article] [PubMed] [Google Scholar]
- 29.Meng, S., Meng, F., Chi, H., Chen, H. & Pang, A. A robust observer based on the nonlinear descriptor systems application to estimate the state of charge of lithium-ion batteries. J. Frankl. Inst.360, 11397–11413 (2023). [Google Scholar]
- 30.Zaman, S., Zafar, S., Ullah, A. & Azeem, M. Computational and molecular characterization of chitosan derivatives by means of graph-theoretic parameters. Part. Differ. Equ. Appl. Math.10, 100726 (2024). [Google Scholar]
- 31.Zaman, S., Yaqoob, H. S. A., Ullah, A. & Sheikh, M. QSPR analysis of some novel drugs used in blood cancer treatment via degree based topological indices and regression models. Polycycl. Aromat. Compd.44, 2458–2474 (2024). [Google Scholar]
- 32.Ullah, A., Bano, Z. & Zaman, S. Computational aspects of two important biochemical networks with respect to some novel molecular descriptors. J. Biomol. Struct. Dyn.42, 791–805 (2024). [DOI] [PubMed] [Google Scholar]
- 33.Meharban, S., Ullah, A., Zaman, S., Hamraz, A. & Razaq, A. Molecular structural modeling and physical characteristics of anti-breast cancer drugs via some novel topological descriptors and regression models. Curr. Res. Struct. Biol.7, 100134 (2024). [DOI] [PMC free article] [PubMed] [Google Scholar]
- 34.Li, X. et al. Computational insights into zinc silicate MOF structures: Topological modeling, structural characterization and chemical predictions. Sci. Rep.14, 19866 (2024). [DOI] [PMC free article] [PubMed] [Google Scholar]
- 35.Sharma, K., Bhat, V. K. & Liu, J.-B. Second leap hyper-Zagreb coindex of certain benzenoid structures and their polynomials. Comput. Theor. Chem.1223, 114088 (2023). [Google Scholar]
- 36.Liu, J.-B., Zheng, Y.-Q. & Peng, X.-B. The statistical analysis for Sombor indices in a random polygonal chain networks. Discrete Appl. Math.338, 218–233 (2023). [Google Scholar]
- 37.Xavier, D. A., Nair A, T., Usman Ghani, M., Baby, A. & Tchier, F. Computing molecular descriptors of boron icosahedral sheet. Int. J. Quantum Chem124, e27443 (2024). [Google Scholar]
- 38.Gutman, I. Geometric approach to degree-based topological indices: Sombor indices. MATCH Commun. Math. Comput. Chem86, 11–16 (2021). [Google Scholar]
- 39.Ghorbani, M., Zangi, S. & Amraei, N. New results on symmetric division deg index. J. Appl. Math. Comput.65, 161–176 (2021). [Google Scholar]
- 40.Rada, J. & Cruz, R. Vertex-degree-based topological indices over graphs. MATCH Commun. Math. Comput. Chem72, 603–616 (2014). [Google Scholar]
- 41.Arockiaraj, M., Clement, J., Paul, D. & Balasubramanian, K. Relativistic distance-based topological descriptors of Linde type A zeolites and their doped structures with very heavy elements. Mol. Phys.119, e1798529 (2021). [Google Scholar]
- 42.Zaman, S., Raza, A. & Ullah, A. Some new version of resistance distance-based topological indices of complete bipartite networks. Eur. Phys. J. Plus139, 357 (2024). [Google Scholar]
- 43.Ullah, A., Salman, S. & Zaman, S. Resistance distance and sharp bounds of two-mode electrical networks. Phys. Scr.99, 085241 (2024). [Google Scholar]
- 44.Zaman, S., Ullah, A. & Shafaqat, A. Structural modeling and topological characterization of three kinds of dendrimer networks. Eur. Phys. J. E Soft Matter46, 36 (2023). [DOI] [PubMed] [Google Scholar]
- 45.Zaman, S., Kamboh, A., Ullah, A. & Liu, J.-B. Development of some novel resistance distance based topological indices for certain special types of graph networks. Phys. Scr.98, 125250 (2023). [Google Scholar]
- 46.Ullah, A., Zaman, S., Hussain, A., Jabeen, A. & Belay, M. B. Derivation of mathematical closed form expressions for certain irregular topological indices of 2D nanotubes. Sci. Rep.13, 11187 (2023). [DOI] [PMC free article] [PubMed] [Google Scholar]
- 47.Arockiaraj, M., Paul, D., Ghani, M. U., Tigga, S. & Chu, Y.-M. Entropy structural characterization of zeolites BCT and DFT with bond-wise scaled comparison. Sci. Rep.13, 10874 (2023). [DOI] [PMC free article] [PubMed] [Google Scholar]
- 48.Salman, M., Ullah, A., Zaman, S., Mahmoud, E. E. & Belay, M. B. 3D molecular structural modeling and characterization of indium phosphide via irregularity topological indices. BMC Chem.18, 101 (2024). [DOI] [PMC free article] [PubMed] [Google Scholar]
- 49.Zhao, D. et al. Banhatti, revan and hyper-indices of silicon carbide Si2C3-III [n, m]. Open Chem.19, 646–652 (2021). [Google Scholar]
- 50.Mahboob, A., Rasheed, M. W., Bayati, J. H. H. & Hanif, I. Computation of several Banhatti and Reven invariants of silicon carbides. Baghdad Sci. J.20, 1099–1099 (2023). [Google Scholar]
- 51.Anjum, M. S. & Safdar, M. U. Banhatti and K hyper-Banhatti indices of nanotubes. Eng. Appl. Sci. Lett.2, 19–37 (2019). [Google Scholar]
- 52.Kulli, V. Revan indices of oxide and honeycomb networks. Int. J. Math. Appl.55, 7 (2017). [Google Scholar]
- 53.Ashraf, R. & Akhter, S. Technology, Revan indices and Revan polynomials of silicon carbide graphs. Int. J. Eng. Res. Technol.8, 353–361 (2019). [Google Scholar]
- 54.Almalki, N. & Tabassum, H. On K-Banhatti, Revan indices and entropy measures of MgO (111) nanosheets via linear regression. Mathematics12, 561 (2024). [Google Scholar]
- 55.Raut, N. & Sanap, G. F-Indices and F-Polynomials for Carbon Nanocones CNCk [n].
- 56.Kulli, V. Modified elliptic revan index of two families of nanotubes. Ann. Pure Appl. Math.29, 103–107 (2024). [Google Scholar]
- 57.Baig, A. Q., Naeem, M. & Gao, W. Revan and hyper-Revan indices of octahedral and icosahedral networks. Appl. Math. Nonlinear Sci.3, 33–40 (2018). [Google Scholar]
- 58.Kulli, V. Hyper-Revan indices and their polynomials of silicate networks. Int. J. Curr. Res. Sci. Technol.4, 17–21 (2018). [Google Scholar]
- 59.Kulli, V. The sum connectivity Revan index of silicate and hexagonal networks. Ann. Pure Appl. Math.14, 401–406 (2017). [Google Scholar]
- 60.Kulli, V. On the product connectivity Revan index of certain nanotubes. J. Comput. Math. Sci.8, 562–567 (2017). [Google Scholar]
- 61.Khanderao, R. N. Harmonic polynomial and harmonic index of molecular graph. Int. J. Eng. Sci. Math.7, 55–61 (2018). [Google Scholar]
- 62.Kulli, V. Multiplicative connectivity Revan indices of polycyclic aromatic hydrocarbons and benzenoid systems. Ann. Pure Appl. Math.16, 337–343 (2018). [Google Scholar]
- 63.Kulli, V. Computation of arithmetic-geometric Revan indices of certain benzenoid systems. J. Glob. Res. Math. Arch.5, 8–13 (2018). [Google Scholar]
- 64.Kulli, V. F-Revan index and F-Revan polynomial of some families of benzenoid systems. J. Glob. Res. Math. Arch.5, 1–6 (2018). [Google Scholar]
- 65.Kulli, V., Mendez-Bermudez, J., Rodriguez, J. M. & Sigarreta, J. M. Revan Sombor indices: Analytical and statistical study. Math. Biosci. Eng.20, 1801–1819 (2023). [DOI] [PubMed] [Google Scholar]
- 66.Rajan, B., Rajasingh, I., Venugopal, P. & Chris Monica, M. Minimum metric dimension of illiac networks. Ars Comb.117, 95–103 (2014). [Google Scholar]
- 67.Parhami, B. & Kwai, D.-M. A unified formulation of honeycomb and diamond networks. IEEE Trans. Parallel Distrib. Syst.12, 74–80 (2001). [Google Scholar]
- 68.Simonraj, F. & George, A. Topological properties of few poly oxide, poly silicate, DOX and DSL networks. Int. J. Future Comput. Commun.2, 90 (2013). [Google Scholar]
- 69.Hayat, S. & Imran, M. Computation of topological indices of certain networks. Appl. Math. Comput.240, 213–228 (2014). [Google Scholar]
- 70.Liu, J. B., Wang, S., Wang, C. & Hayat, S. Further results on computation of topological indices of certain networks. IET Control Theory Appl.11, 2065–2071 (2017). [Google Scholar]
- 71.Asad, U. et al. Neighborhood topological effect on grain topology-size relationship in three-dimensional polycrystalline microstructures. Chin. Sci. Bull.58, 3704–3708 (2013). [Google Scholar]
- 72.Mondal, S., De, N. & Pal, A. On Some New Neighborhood Degree-Based Indices for Some Oxide and Silicate Networks, 384–409 (2019).
- 73.Mondal, S., De, N. & Pal, A. On neighborhood Zagreb index of product graphs. J. Mol. Struct.1223, 129210 (2021). [DOI] [PMC free article] [PubMed] [Google Scholar]
- 74.Randić, M. & Trinajstić, N. In search for graph invariants of chemical interes. J. Mol. Struct.300, 551–571 (1993). [Google Scholar]
- 75.Randic, M., Guo, X., Oxley, T., Krishnapriyan, H. & Naylor, L. Wiener matrix invariants. J. Chem. Inf. Comput. Sci.34, 361–367 (2002). [Google Scholar]
- 76.Calvin, W. R. Handbook of Chemistry and Physics. a Ready-Reference Book of Chemical and Physical Data 66th edn. (CRC Press, 1986). [Google Scholar]
- 77.Das, K. C., Mondal, S. & Raza, Z. On Zagreb connection indices. Eur. Phys. J. Plus137, 1242 (2022). [Google Scholar]
- 78.Ethermo calculation platform. http://www.ethermo.us/default.aspx. Accessed 14 November (2022).
Associated Data
This section collects any data citations, data availability statements, or supplementary materials included in this article.
Data Availability Statement
All data generated or analyzed during this study are included in this article.