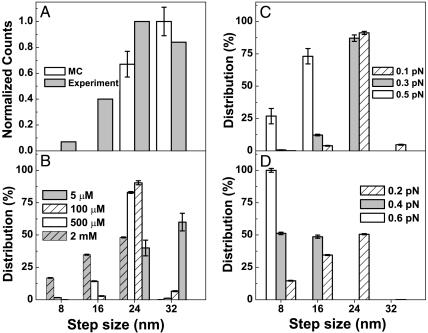
Fig. 4.
Step-size distribution of dynein for various values of load and ATP concentration. (A) Comparison of experimental step size distribution (18) with Monte Carlo simulations (MC) at [ATP] = 5 μM with no load. The experimental distribution of the step size was reproduced by using 8-nm bins for the sake of comparison with the simulation result. (B) Predicted step-size distribution with no load for various ATP concentrations. (C) Predicted step-size distribution for [ATP] = 100 μM for various loads. (D) Predicted step-size distribution for [ATP] = 1 mM for various loads. Simulation results are from 10 runs, each of 1,000-s duration. The error bars represent the standard deviation and are symmetrical about the average.

