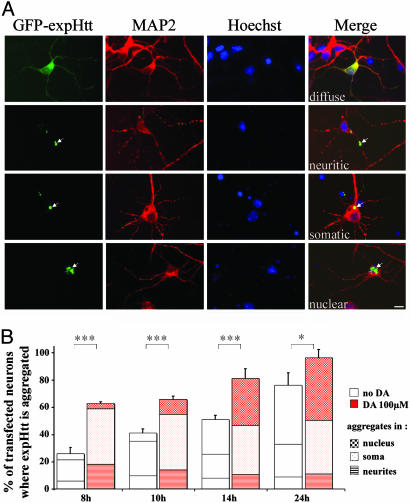
Fig. 4.
DA increases aggregate formation of expHtt. (A) GFP-tagged expHtt localizations at 10 h. Neuronal compartments were defined by using immunolabeling of MAP2 (in red) for neurites and soma and Hoechst staining (in blue) for the nucleus. Merge represents the combined image of MAP2, Hoechst, and GFP. Note the four different patterns at this time point: diffuse or present in neuritic, somatic, or nuclear aggregates (arrows). (Scale bar, 10 μm.) (B) Effect of DA on expHtt aggregate formation at different time points after transfection (8, 10, 14, and 24 h). ANOVA revealed significant differences in aggregate formation of expHtt when neurons were treated with 100 μM DA (compare for each time point: left column in each column pair, no DA; right column in each column pair, 100 μM DA). For each time point, the number of transfected neurons where expHtt is aggregated is significantly higher in the presence of 100 μM DA (right column in each column pair) (Fisher's analysis; ***, P < 0.001; *, P < 0.05).

