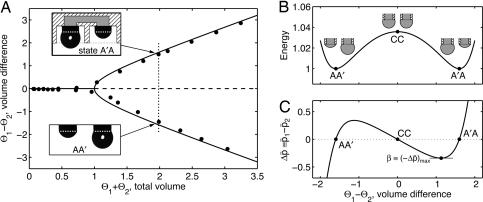
Fig. 1.
Behavior of bistable system of coupled droplets, showing droplet 1 of volume Θ1, at left, and 2 of Θ2, at right. Volume is scaled by 4 π B3/3; only liquid below the contact-line (white dots in A Insets) is counted. (A) Equilibrium bifurcation diagram showing bistability for Θ1 + Θ2 > 1 (line, model; circles, experiments). (Insets) Image of droplets on nozzles (radius B = 0.85 mm). (Upper Inset) Schematic superposed on image demonstrates shielding (right) and exposure (left) that are used in applications. (Lower Inset) Image alone. Data were obtained with a threshold edge detection algorithm. (B and C) Nonequilibrium response for constant total volume (Θ1 +Θ2 = 2), assuming spherical-cap droplets. Note that switching from top to bottom along dotted line in A means right to left in B and C. (B) Normalized energy landscape (droplet surface areas) shows the barrier to switching at the unstable equilibrium CC. (C) Interdroplet pressure difference (normalized here only, p̄ = p·B/σ), with maximum resistance indicated by β.

