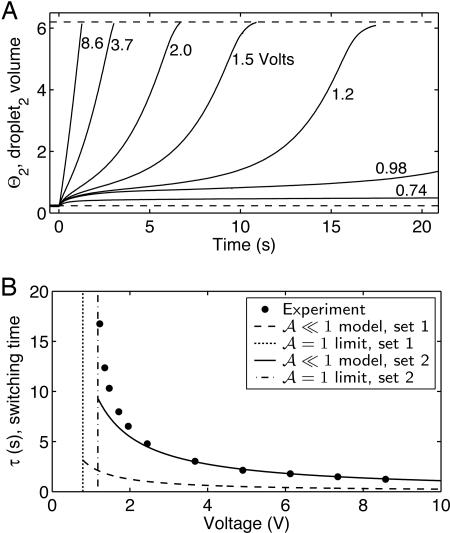
Fig. 3.
Time course of switching at constant voltage. At the start of each test, Θ1 ≈ 6.2 and Θ2 ≈ 0.3. The same droplets are used for all data, and total volume loss over the 20-min duration of the entire experiment was ≈5%. (A) Volume change over time (various voltages). The system stalls at 0.74 V, but 0.98 V is sufficient for switching (limited image storage precluded more data). (B) Summary of A: switching time τ against voltage (symbols). Model curves (solid) plot Eq. 4 (set 1 and set 2 parameters). Vertical limits (dashed) plot V* according to  . Several data shown do not appear in A.

