
FIGURE 6.
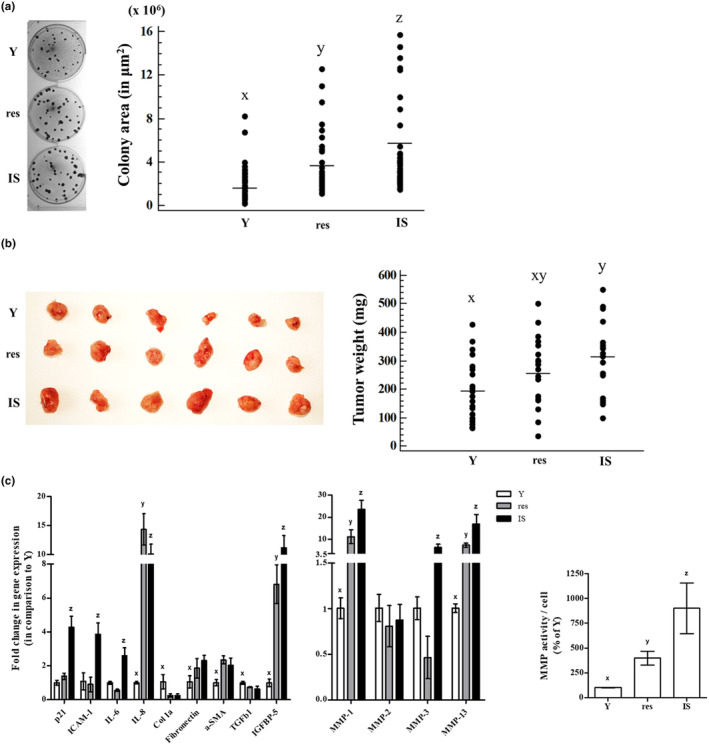
Resistant HDFs promote cancer cells' growth in vitro and in vivo. (a) Confluent cultures of young (Y), resistant (res), and ionizing radiation‐induced senescent (IS) HDFs were overlaid with A431 cells and further incubated for 12 days. At the end of the 12‐day incubation period, co‐cultures were stained with rhodanile blue, observed under the microscope, and colonies' area in μm2 was calculated. Dissimilar letters denote statistically significant differences among compared samples (ANOVA, Tukey's test, p < 0.05). (b) A431 cells were injected in three different spots in the back of severe combined immunodeficiency (SCID) mice along with an equal number of young (Y), resistant (res), or ionizing radiation‐induced senescent (IS) HDFs. Animals were sacrificed 2 weeks post‐injections, tumors were removed, and weighed. Photographs of tumors excised from 6 representative animals are presented here. Groups not sharing a common letter are considered significantly different (ANOVA, Tukey's test, p < 0.05). (c) Total RNA was extracted from young (Y), resistant (res), and ionizing radiation‐induced senescent (IS) HDFs and was then used for RT‐qPCR analysis using specific primers for the designated genes. Glyceraldehyde‐3‐phosphate dehydrogenase (GAPDH) was used as the reference gene. Numerical values are the means ± standard deviations of at least two independent experiments conducted in duplicates. Dissimilar letters denote statistically significant differences between any pair of means for every gene tested (ANOVA, Tukey's test, p < 0.05). Conditioned media of young (Y), resistant (res) and ionizing radiation‐induced senescent (IS) HDFs were collected and concentrated 10‐fold, before the determination of MMP activity using the fluorogenic substrate Dabcyl‐Gaba‐Pro‐Gln‐Gly‐Leu‐Glu‐(EDANS)‐Ala‐Lys‐NH2. After incubation at 37°C for 48 h in the dark, fluorescence was measured at 480 nm after excitation at 340 nm. Enzymatic activity per cell was expressed as a % ratio of that of Y cells. Numerical values are the means ± standard deviations of three independent experiments conducted in duplicates. Dissimilar letters denote statistically significant differences in the enzymatic activity among the three compared samples (ANOVA, Tukey's test, p < 0.05).