

Abstract
Given the application of cycloalkanes in surrogate blends for aviation fuels, their determination of critical characteristics pertinent to fuel transportation and combustion becomes imperative. In this study, we aim to construct intelligent models based on machine learning methods of random forest (RF), adaptive boosting, decision tree (DT), ensemble learning, K-nearest neighbors (KNN), support vector machine (SVM), multi-layer perceptron (MLP) artificial neural network and convolutional neural network (CNN) to predict the density of binary blends of ethylcyclohexane or methylcyclohexane with n-hexadecane/n-dodecane/n-tetradecane in terms of operational conditions (pressure and temperature) and cycloalkane mole fractions in n-alkanes, utilizing laboratory data extracted from existing scholarly publications. The reliability of the data used is affirmed using an outlier detection algorithm, and the relevancy factor concept is utilized to find the relative effects of the input parameters on the output parameter. The preciseness of the developed models is checked and compared comprehensively via statistical and graphical methods. The obtained results indicate that temperature has the most effect on density, with a relevancy value of − 0.9619, and pressure has the least effective value, with a relevancy value of 0.041, which explains the straight relationship between pressure and density. The modeling results illustrate that DT and RF algorithms have the best performance in calculating density with R2 values of 0.9985 and 0.09982, respectively. The MLP and Adaboosting models exhibit the weakest performance in this field, with R2 values of 0.9455 and 0.9477, respectively. The current paper indicates robust tools for the accurate prediction of the density of binary blends of ethyl cyclohexane or methylcyclohexane with n-hexadecane/n-dodecane/n-tetradecane, which are required for fuel transportation and combustion studies.
Keywords: Intelligent modeling, Machine learning, Density, Sensitivity analysis
Subject terms: Chemical engineering, Physical chemistry
Introduction
Broadly speaking, regular petroleum derivatives, including gasoline and aviation fuels, are composed of a vast array of hydrocarbons, numbering in the hundreds1. The primary constituents of these fuels include normal alkanes, isoparaffins, naphthenes, and aromatics, with normal alkanes and naphthenes featuring alkyl side chains being especially crucial in the composition of aviation fuels2–5. These blends are used in fuel production, such as jet fuel. This fuel includes four main hydrocarbon groups: linear alkanes, aromatics, branched alkanes, and cycloalkanes. The relative amounts of these components highly affect the performance of the jet fuel in combustion, atomization, aircraft range, metering, and thermal stability. It should be mentioned that fuel quality has a direct effect on global warming issues6. Accurately delineating their fundamental properties presents a significant challenge due to the various hydrocarbons and their intricate interactions. This complexity consequently impedes the precise simulation of fluid dynamics and the design of heat exchange systems6–10.
Within aviation fuel composition, straight-chain alkanes such as n-dodecane, n-hexadecane, and n-tetradecane are frequently selected as representative model compounds. Conversely, shorter alkyl cycloalkanes are utilized for the cycloalkane category, with methylcyclohexane and ethylcyclohexane being commonly employed exemplars8,11–13. Regarding the investigation into either methylcyclohexane or ethyl cyclohexane independently14,15, there exists a wealth of density-related data, which has been extensively documented by various researches16–20. However, the study of physical properties, such as the density of binary mixtures comprising these cycloalkanes and straight-chain alkanes, has received relatively scant attention.
The importance of studying fuels10 and ignition21 and the properties that may affect their performance is undeniable22. Given the application of cycloalkanes in surrogate mixtures for aviation fuels, determining critical properties pertinent to fuel transportation and combustion becomes imperative for combinations of these compounds with n-alkanes23. Acquiring basic physical property data remains challenging across broad pressure and temperature spectra, even for binary mixtures with rudimentary composition. Therefore, elucidating and measuring the physical characteristics of such binary blends encompassing thermal expansion, compressibility, and density form the foundational groundwork for the advanced evaluation and modeling of complex aviation fuels. Consequently, many researchers have embarked on experimental investigations into their physical properties. For instance, Prak et al.23 conducted studies on the physical properties of mixtures of methylcyclohexane or ethylcyclohexane with n-dodecane or n-hexadecane across temperatures ranging from 293.15 to 333.15 K and at a pressure of 0.1 MPa. By comparing these properties with those of traditional petroleum-based fuels, they deduced that mixtures involving ethylcyclohexane and n-hexadecane most closely resemble jet fuel characteristics. Baragi et al.24 explored the densities and forecasted the excess molar volume of methylcyclohexane and n-dodecane mixtures at temperatures between 298.15 and 308.15 K and a pressure of 0.1 MPa. Calvar et al.25 assessed the density values of aromatic hydrocarbons-methylcyclohexane blends at a temperature of 313.15 K and pressure of 0.1 MPa. Van Hecke et al.26 experimentally determined densities for ethyl cyclohexane blends with organic compounds at temperatures of 288.15 and 318.15 K while at a constant pressure of 0.1 MPa, noting an uncertainty of 0.0005 g/cm3. However, the influence of purity variations on this uncertainty was not discussed. Prak et al.27 presented density measurements for n-alkylcyclohexane/n-tetradecane mixtures from 288.15 to 333.15 K at 0.1 MPa, specifying an expanded uncertainty of 0.3 kg/m3. Wang et al.28 opted for n-dodecane, n-hexadecane, and n-tetradecane as proxies for straight-chain alkanes and methylcyclohexane/ethylcyclohexane representing alkyl cycloalkanes, conducting density measurements for six mixtures across a pressure range from 0.1 to 9 MPa and temperature span of 280–423.15 K, thus covering the operational circumstances of most engineering applications. Chum-in et al. developed correlations to estimate density of binary biofuel mixture by using Gibbs energy29. Cano-Gómez et al. suggested a non-linear relationship based on the fractional ratios to determine viscosity of a binary system30. Krisnangkura et al. implemented an approach to determine viscosity of mixtures of diesel and biodiesel based on the molecular similarities31. Yoon et al. suggested a method in terms of temperature and proportional ratio to predict the density of soybean oil and diesel mixtures32.
The comprehensive laboratory research outlined previously underscores a labor-intensive and intricate process, necessitating sophisticated analytical techniques alongside the employment of high-cost laboratory apparatus. Concurrently, the domain of artificial intelligence (AI) has manifested remarkable efficacy in a myriad of applications33, spanning interpretation and prognostication tasks across diverse fields34–42. It is of particular interest that, despite the acute demand for data characterizing the density of hydrocarbon mixtures under elevated pressures and temperatures, a noticeable gap exists in the endeavor to formulate models leveraging advanced intelligent modeling methodologies. In this vein, the present study aims to harness cutting-edge machine learning techniques, including Random Forest (RF), Adaptive Boosting, Decision Tree (DT), Ensemble Learning, K-Nearest Neighbors (KNN), Support Vector Machine (SVM), Multi-Layer Perceptron(MLP) Artificial Neural Network and Convolutional Neural Network (CNN). These methodologies are employed to predict the density of binary blends of Ethylcyclohexane or methylcyclohexane with n-hexadecane/n-dodecane/n-tetradecane across an extensive range of operational conditions (encompassing pressure and temperature) and cycloalkane mole fractions in n-alkanes, utilizing refined laboratory data extracted from existing scholarly publications. The reliability of the utilized data is affirmed through an outlier detection algorithm, and a relevancy factor is applied to determine the significance of each input variable on the mixture density. Additionally, the precision of the developed models is stringently assessed using statistical indices and graphical representation techniques.
Methodology
Data gathering
This investigation leverages a detailed dataset comprising 1461 datapoints, culled from a thorough review of extant scholarly articles23,24,28, dedicated predominantly to the empirical determination of the density of binary blends involving ethylcyclohexane or methylcyclohexane and n-hexadecane/n-dodecane/n-tetradecane. This dataset spans a broad spectrum of mole fractions, temperatures, and pressures. The statistical attributes of all experimental data employed in the modeling process are systematically cataloged in Table 1. For model development, 1156 data points are utilized for training, while 158 and 147 data points validate and test the constructed models’ potential, respectively.
Table 1.
Statistical data pertinent to the experimental data.
| Input parameters | Output parameter | |||
|---|---|---|---|---|
| Mole fraction | Temperature (K) | Pressure (MPa) | Density (mPa s) | |
| Minimum | 0 | 280 | 0.1 | 37.38 |
| Maximum | 1 | 423.15 | 9 | 805 |
| Average | 0.6 | 344.63 | 4.61 | 649.61 |
| Standard deviation | 0.24 | 47.95 | 2.81 | 732.68 |
Machine learning approaches
We delve into the mathematical foundations underpinning the machine learning algorithms employed for the development of intelligent models in this study. The details of theory of these models are reported in Appendix.
Results and discussion
In this part, the density of binary blends for ethyl cyclohexane or methylcyclohexane with n-hexadecane/n-dodecane/n-tetradecane is estimated by using eight machine learning methods. First, the hyper-parameters are determined for each model. For example, the max-depth is estimated to be 15 for DT algorithm as shown in Fig. 1. Then, Fig. 2 illustrates that the performance of the KNN algorithm in the K value of 1 is better than other K values.
Fig. 1.
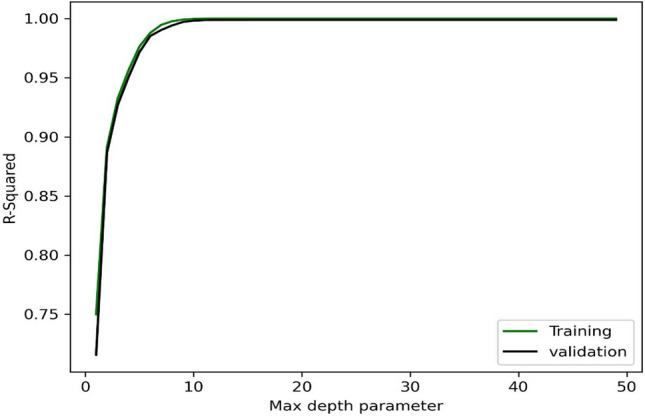
The estimation of max-depth in the DT model.
Fig. 2.

The estimation of K in the KNN model.
Figure 3 demonstrates the R-squared values for different c values in the SVM algorithm, and the optimum value of c is obtained at about 1. The accuracy values of AdaBoosting in terms of the number of estimators are shown in Fig. 4. As illustrated, 63 estimators are the best structure for this model. After that, it is determined that the RF model with 9 estimators shows the most accuracy in the max-depth value of 9 (See Fig. 5).
Fig. 3.
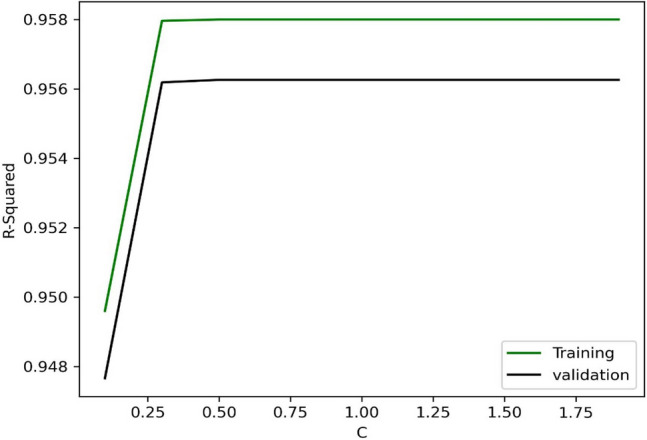
SVM algorithm performance for disparate c values.
Fig. 4.

Adaptive Boosting algorithm performance for disparate numbers of estimators.
Fig. 5.

Hyper-parameter estimation for the RF algorithm.
The performance of CNN and MLP methods during the training process is shown in Figs. 6 and 7, respectively.
Fig. 6.

The MSE values in different iterations for the CNN model.
Fig. 7.

The MSE values in different iterations for the MLP model.
The chosen hyper-parameters for each algorithm are reported briefly in Table 2.
Table 2.
The chosen hyper-parameters for each algorithm.
| Model | Hyper-parameter |
|---|---|
| SVM | C = 1, kernel = rbf, degree = 3, |
| DT | Max-depth = 15, criterion = squared_error, min_samples_split = 2, min_samples_leaf = 1, |
| Adaptive Boosting | Number of estimators = 63, learning_rate = 1.0, loss = linear |
| RF | Max-depth = 9, Number of estimators = 9, min_samples_split = 3 |
| EL | Includes DT, SVM and KNN |
| MLP | 1 Dense layer(128 Neurons), 1 Dense layers(64 Neurons), 2 Dense layers(16 Neurons), 2 Dense layers(8 Neurons), 1 Dense layer(4 Neurons). loss = mse, Activation function: elu , learning rate = 0.001 |
| CNN | 1 Conv1D layers(64), 2 Conv1D layers(16), 1 Dense layer(128 Neurons), 1 Dense layers(64 Neurons), 1 Dense layer(16 Neurons), 1 Dense layer(8 Neurons), 1 Dense layer(4 Neurons). loss = mse, Activation function: elu , learning rate = 0.01 |
Some statistical parameters are employed to assess the models mentioned above. They are defined as below:
 |
1 |
 |
2 |
 |
3 |
 |
4 |
The summary of statistical analysis is reported in Table 3. For better description, the MAPE values are shown in Fig. 8, and it shows that the RF and DT models are the most accurate models in the calculation of density with MAPE values of 4.527 and 4.6935, respectively.
Table 3.
The summary of statistical analysis.
| Model | Run Time | R-squared | MAPE | MAE | MSE | ||||||||
|---|---|---|---|---|---|---|---|---|---|---|---|---|---|
| Training | Validation | Testing | Training | Validation | Testing | Training | Validation | Testing | Training | Validation | Testing | ||
| SVM | 0.0094 | 0.9579 | 0.9562 | 0.9593 | 16.3489 | 16.6465 | 40.6545 | 0.0407 | 0.0408 | 0.0361 | 0.0024 | 0.0024 | 0.0021 |
| MLP | 10.6822 | 0.9506 | 0.9447 | 0.9455 | 15.1776 | 18.2716 | 24.8411 | 0.0437 | 0.0458 | 0.0407 | 0.0029 | 0.0030 | 0.0028 |
| CNN | 15.7672 | 0.9855 | 0.9841 | 0.9773 | 7.4173 | 7.2048 | 21.8950 | 0.0229 | 0.0248 | 0.0270 | 0.0008 | 0.0008 | 0.0011 |
| Ensemble learning | 0.0217 | 0.9953 | 0.9917 | 0.9934 | 5.4496 | 6.2881 | 15.7982 | 0.0135 | 0.0163 | 0.0141 | 0.0002 | 0.0004 | 0.0003 |
| RF | 0.0407 | 0.9992 | 0.9982 | 0.9982 | 1.5013 | 2.6194 | 4.5270 | 0.0048 | 0.0081 | 0.0073 | 0.0000 | 0.0001 | 0.0001 |
| KNN | 0.0005 | 1.0000 | 0.9798 | 0.9880 | 0.0000 | 5.8111 | 5.9151 | 0.0000 | 0.0191 | 0.0149 | 0.0000 | 0.0011 | 0.0006 |
| DT | 0.0163 | 1.0000 | 0.9988 | 0.9985 | 0.0000 | 2.8254 | 4.6935 | 0.0000 | 0.0071 | 0.0077 | 0.0000 | 0.0001 | 0.0001 |
| Adaptive boosting | 0.2623 | 0.9574 | 0.9520 | 0.9477 | 16.3788 | 19.3579 | 36.6926 | 0.0419 | 0.0441 | 0.0442 | 0.0025 | 0.0026 | 0.0027 |
Fig. 8.
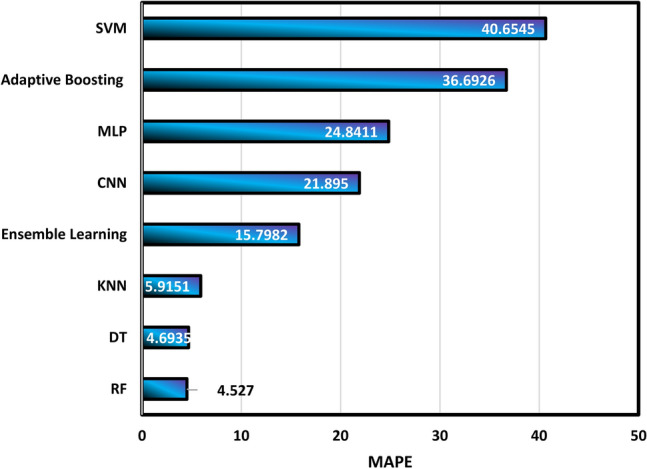
Calculation of MAPE values for different algorithms.
Figure 9 confirms that DT and RF algorithms have acceptable performance in the calculation of density with R2 values of 0.9985 and 0.09982, respectively. On the other hand, the MLP and Adaboosting models exhibit the weakest performance in this field, with R2 values of 0.9455 and 0.9477, respectively. Then, the summary of the determination of MAE and MSE is shown in Figs. 10 and 11, respectively.
Fig. 9.
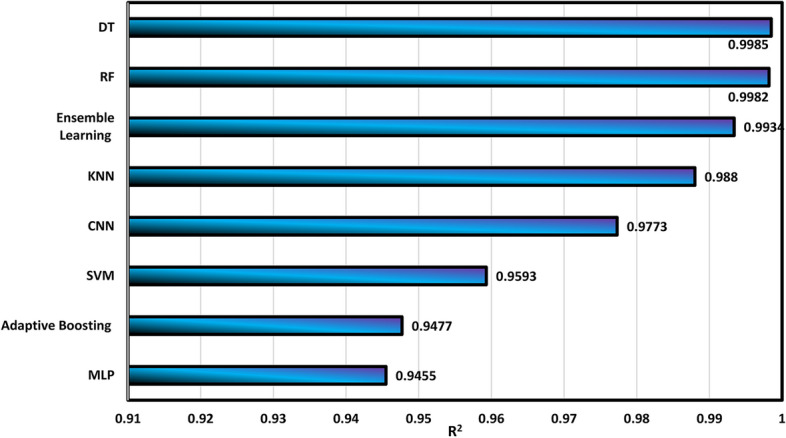
Calculation of R2 values for different algorithms.
Fig. 10.
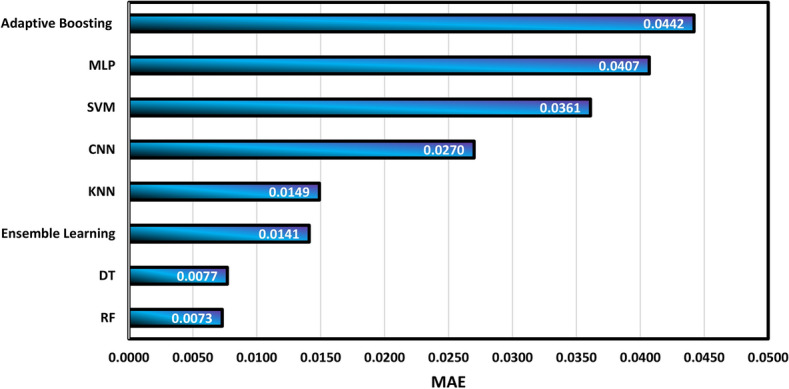
Calculation of MAE values for different algorithms.
Fig. 11.
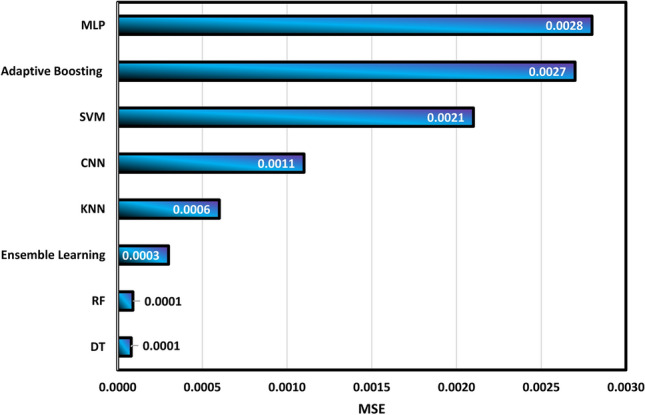
Calculation of MSE values for different algorithms.
The predicted density is demonstrated against the actual density in Fig. 12, in which density points’ compaction expresses the models’ precision. In addition, the fitting lines on the different subsets of data points are constructed, and they seem similar to the bisector line. After that, the relative error between the predicted and real density values is shown for each model in Fig. 13. if the relative errors lie near the x-axis, the model will be more accurate.
Fig. 12.


The predicted density versus the actual density.
Fig. 13.


The relative error between the predicted and actual density values.
One of the critical points in selecting the best estimator is the time required for training the model. Due to this fact, the time spent training each model is reported in Fig. 14, and it seems that neural network models require more time than others.
Fig. 14.

Calculation of run time for different algorithms.
It is worth mentioning the advantages and disadvantages of these models. The KNN algorithm has a simple implementation procedure but can be computationally expensive for large data banks. Also, the SVM is computationally expensive but works well with small databanks. DT is robust to outliers but prone to overfitting. On the other hand, RF is robust to overfitting and high accuracy because of ensemble learning. ANN-based algorithms can be used for complex tasks, but they need high processing time.
The accuracy of the utilized dataset in the training of algorithms has vital importance. Hence, assessing the precision of ethylcyclohexane/methylcyclohexane with n-dodecane/n-tetradecane/n-hexadecane density databank is necessary. The leverage method, which is based on mathematical techniques, is employed in this work. There is a matrix shown by H, and it is called the Hat matrix and determined as below43–45:
 |
5 |
In this definition, X is  dimensional matrix, in which dimensions are the number of data points and model parameters, respectively. Then, the reliable and outlier zones should be identified. Hence, the critical value of H* is defined as follows:
 |
6 |
Then, the William’s plot is applied to indicate the results of this analytical technique.The normalized residuals are plotted against the Hat values in this plot. These Hat values is determined by using the main diagonal of H. Figure 15 expresses the situation of these data points in this method and it is obvious that all data points are reliable. Therefore, they have enough accuracy to be used in the development of algorithms. In this work, the best model, DT, is used to generate this graph and analysis.
Fig. 15.

Outlier detection.
The effect of pressure, temperature, and mole fraction of cycloalkane on density of ethyl cyclohexane/methylcyclohexane with n-dodecane/n-tetradecane/n-hexadecane is determined by the relevance factor ( ). This parameter is used to predict the effect of a particular variable (xj) on the density (y). The below formulation describes the procedure of this method46,47:
 |
7 |
The determined parameter lies between –1 and 1 with negative sign showing that the density decreases by increasing that particular parameter. Furthermore, a higher value of r represents the stronger relationship between that particular input and density. As shown in Fig. 16, temperature has the most impact on the density, with an r value of –0.9619. Also, the negative sign expresses a reverse relationship between temperature and density. On the other hand, pressure is the least effective, with an r value of 0.041, which explains the straight relationship between pressure and density.
Fig. 16.

Relevancy factor for density of ethylcyclohexane/methylcyclohexane with n-dodecane/n-tetradecane/n-hexadecane databank.
Conclusions
In this study, several artificial intelligence methods are applied to forecast the density values of ethyl cyclohexane/methylcyclohexane blended with n-dodecane/n-hexadecane/n-tetradecane in terms of operational conditions (encompassing pressure and temperature) and cycloalkane mole fractions in n-alkanes. A number of 1461 data points which lie in the extensive range of conditions are used in suggesting models. These data points are assessed using a mathematical method, and it is obtained that all data points are maintained in the reliable region. Hence, they can be used in different steps of model development. The carried out sensitivity analysis by the relevancy factor concept exhibits that temperature is the most influential parameter on the density with r value of –0.9619. Also, the negative sign expresses a reverse relationship between temperature and density. The statistical and graphical comparisons between the developed models show that the DT and RF algorithms have the best performance in calculating density with R2 values of 0.9985 and 0.09982, respectively. According to the results, this paper provides several robust tools to calculate the density of Ethylcyclohexane /methylcyclohexane with n-dodecane/n-tetradecane/n-hexadecane that is useful for chemical engineers and chemists.
Supplementary Information
List of symbols
- RF
Random forest
- DT
Decision tree
- KNN
K-nearest neighbors
- SVM
Support vector machine
- MLP
Multi-layer perceptron
- CNN
Convolutional neural network
- R2
R-squared
- AI
Artificial intelligence
- ANN
Artificial neural network
- XGBoost
Extreme gradient boosting
- GBRT
Gradient boosting regression tree
- ϕ(x)
Nonlinear mapping
- ∥w∥2
The regularization term
- EL
Ensemble learning
- x
Lower-dimensional input
- ϵ
Insensitive loss function
- C
Regularization constant
- ξ
Slack variable
- w
Weight
- b
Bias
- ai
Lagrange multiplier

Lagrange multiplier
- K
Kernel function
- RBF
Radial basis function
- γ
The breadth of the Gaussian function
- FT
Weak learner
- X
Input variable
- Et
Aggregate error

Enhanced weak learner
- n
Number of points
- Di
Euclidean distance
- yi
I’th training sample value
- Cp
The test data sample predicted value
- Ct
Adjacent neighbor
- v1,1
Value within the subsequent layer
- F
Size of filter
- k
Row number
- δ
Activation function
- Vi
Random vector
- MAPE
Mean absolute percentage error
- MSE
Mean squared error
- R2
R-square
- MRE
Mean relative error
- H
Hat matrix
- m
Number of data points
- H*
Critical leverage value

Relevance factor

Average of a particular variable values

Average of target values
Author contributions
Ali Yarahmadi: Conceptual, Formal Analysis, Writing and Review (draft), Writing and Review (edit). Ali Rashedi: Supervision, Resources, Validation. Amin Bemani: Validation, Writing and Review (draft), Writing and Review (edit), Writing and Review (edit)
Data availability
Data file is available as a supplementary file.
Declarations
Competing interests
The authors declare no competing interests.
Footnotes
Publisher’s note
Springer Nature remains neutral with regard to jurisdictional claims in published maps and institutional affiliations.
Supplementary Information
The online version contains supplementary material available at 10.1038/s41598-025-92608-2.
References
- 1.Song, Y. et al. Cyclic coupling and working characteristics analysis of a novel combined cycle engine concept for aviation applications. Energy301, 131747 (2024). [Google Scholar]
- 2.Wu, X. et al. Production of jet fuel range biofuels by catalytic transformation of triglycerides based oils. Fuel188, 205–211 (2017). [Google Scholar]
- 3.Zhang, X., Lei, H., Zhu, L., Wu, J. & Chen, S. J. G. C. From lignocellulosic biomass to renewable cycloalkanes for jet fuels. Green Chem.17(10), 4736–4747 (2015). [Google Scholar]
- 4.Liu, H. & Zhu, L. Excess molar volumes and viscosities of binary systems of butylcyclohexane with n-alkanes (C7 to C14) at T= 293.15 K to 313.15 K. J. Chem. Eng. Data59(2), 369–375 (2014). [Google Scholar]
- 5.Edwards, T. “Kerosene” fuels for aerospace propulsion-composition and properties. In 38th AIAA/ASME/SAE/ASEE Joint Propulsion Conference & Exhibit 3874 (2002).
- 6.Mei, Q., Liu, L. & Mansor, M. R. A. Investigation on spray combustion modeling for performance analysis of future low-and zero-carbon DI engine. Energy302, 131906 (2024). [Google Scholar]
- 7.Jin, Z.-H. et al. Pyrolysis study of a three-component surrogate jet fuel. Combust. Flame226, 190–199 (2021). [Google Scholar]
- 8.Edwards, T. & Maurice, L. Q. Surrogate mixtures to represent complex aviation and rocket fuels. J. Propul. Power17(2), 461–466 (2001). [Google Scholar]
- 9.Liu, Y.-X., Richter, S., Naumann, C., Braun-Unkhoff, M. & Tian, Z. Y. Combustion study of a surrogate jet fuel. Combust. Flame202, 252–261 (2019). [Google Scholar]
- 10.Chen, L. et al. Impacts of fuel stage ratio on the morphological and nanostructural characteristics of soot emissions from a twin annular premixing swirler combustor. Environ. Sci. Technol.58(24), 10558–10566 (2024). [DOI] [PubMed] [Google Scholar]
- 11.Tian, D. X., Liu, Y. X., Wang, B. Y. & Tian, Z. Y. A merged kinetic mechanism study of two aviation surrogate fuels. Fuel289, 119767 (2021). [Google Scholar]
- 12.Huber, M. L., Lemmon, E. W., Diky, V., Smith, B. L. & Bruno, T. J. Chemically authentic surrogate mixture model for the thermophysical properties of a coal-derived liquid fuel. Energy Fuels22(5), 3249–3257 (2008). [Google Scholar]
- 13.Windom, B. C., Huber, M. L., Bruno, T. J., Lown, A. L. & Lira, C. T. Measurements and modeling study on a high-aromatic diesel fuel. Energy Fuels26(3), 1787–1797 (2012). [Google Scholar]
- 14.Mali, A. R., Vutukuru, K. & Wornat, M. J. Polycyclic aromatic hydrocarbons production from the supercritical pyrolysis of n-decane, ethylcyclohexane, and n-decane/ethylcyclohexane blends. Proc. Combust. Inst.39(1), 1019–1028 (2023). [Google Scholar]
- 15.Kumar, R., Velamati, R. K. & Kumar, S. Combustion of methylcyclohexane at elevated temperatures to investigate burning velocity for surrogate fuel development. J. Hazard. Mater.406, 124627 (2021). [DOI] [PubMed] [Google Scholar]
- 16.Li, D. et al. Densities and viscosities for the ternary system of (ethylcyclohexane+ 1-butanol+ ethyl octanoate) and corresponding binary systems at T = (293.15–323.15) K. J. Chem. Thermodyn.150, 106173 (2020). [Google Scholar]
- 17.Matsukawa, H., Kuwabara, K., Shimada, Y., Tsuji, T. & Otake, K. Densities for carbon dioxide/cyclohexane, methylcyclohexane, and ethylbenzene systems. J. Chem. Thermodyn.142, 105902 (2020). [Google Scholar]
- 18.Li, D. et al. Density, viscosity, and refractive index of binary mixtures of fatty acid ethyl esters with ethylcyclohexane. J. Chem. Eng. Data64(12), 5324–5331 (2019). [Google Scholar]
- 19.Yoneda, Y., Sato, S., Matsumoto, T. & Miyamoto, H. Density of methylcyclohexane at temperatures up to 600 K and pressures up to 200 MPa. Int. J. Thermophys.38, 1–7 (2017). [Google Scholar]
- 20.Usman, M. R., Shahid, Z., Akram, M. S. & Aslam, R. Densities and thermal expansion coefficients of pure methylcyclohexane, 1-methylcyclohexene, 4-methylcyclohexene, 1-methyl-1, 4-cyclohexadiene, and toluene and binary mixtures of methylcyclohexane and toluene at 283.15 K to 358.15 K and 1 atm. Int. J. Thermophys.41, 1–17 (2020). [Google Scholar]
- 21.Fan, R., Pan, Y., Xiao, Y. & Wang, Z. Investigation on flame propagation characteristics and critical ignition criteria of hydrogen jet. Int. J. Hydrog. Energy57, 1437–1445 (2024). [Google Scholar]
- 22.Cao, X. et al. Experimental research on the synergy effect of resistance/inhibition on the syngas explosion. Fuel363, 130995 (2024). [Google Scholar]
- 23.Luning Prak, D. J., Mungan, A. L., Cowart, J. S. & Trulove, P. C. Densities, viscosities, speeds of sound, bulk moduli, surface tensions, and flash points of binary mixtures of ethylcyclohexane or methylcyclohexane with n-dodecane or n-hexadecane at 0.1 MPa. J. Chem. Eng. Data63(5), 1642–1656 (2018). [Google Scholar]
- 24.Baragi, J. G. et al. Excess properties of the binary mixtures of methylcyclohexane+ alkanes (C6 to C12) at T= 298.15 K to T= 308.15 K. J. Chem. Thermodyn.38(1), 75–83 (2006). [Google Scholar]
- 25.Calvar, N., Gonzalez, B., Gomez, E. & Canosa, J. Density, speed of sound, and refractive index for binary mixtures containing cycloalkanes and aromatic compounds at T = 313.15 K. J. Chem. Eng. Data54(4), 1334–1339 (2009). [Google Scholar]
- 26.Van Hecke, G. R., Baldwin, O. W. & Wada, B. C. Viscosity, refractive index, isobaric specific heat capacity, ultrasonic velocity, molar volume, isentropic compressibility, isothermal compressibility, and heat capacity ratio for binary mixtures of the organic liquids ethylbenzene, ethylcyclohexane, pentylbenzene, and pentylcyclohexane at 298.15 K and 0.1 MPa. J. Chem. Eng. Data67(5), 1037–1053 (2022). [Google Scholar]
- 27.Luning Prak, D. J. Densities, viscosities, and speeds of sound of n-tetradecane and n-alkylcyclohexane binary mixtures within the temperature range (288.15–333.15) K. J. Chem. Eng. Data68(7), 1610–1623 (2023). [Google Scholar]
- 28.Wang, J. et al. Measuring and modeling the density of some typical binary mixtures in the conditions of 280–423.15 K and 01–9 MPa. J. Chem. Eng. Data69(1), 73–91 (2023). [Google Scholar]
- 29.Chum-in, T., Panpipat, W., Chaijan, M., Phankosol, S. & Ikram, R. Density-Gibbs energy correlation models for binary biofuel mixtures. J. Mol. Liq.409, 125435 (2024). [Google Scholar]
- 30.Cano-Gomez, J. J., Iglesias-Silva, G. A., Rivas, P., Diaz-Ovalle, C. O. & de JesusCerino-Cordova, F. Densities and viscosities for binary liquid mixtures of biodiesel + 1-butanol, + isobutyl alcohol, or + 2-butanol from 293.15 to 333.15 K at 0.1 MPa. J. Chem. Eng. Data62(10), 3391–3400 (2017). [Google Scholar]
- 31.Krisnangkura, K., Sansa-Ard, C., Aryusuk, K., Lilitchan, S. & Kittiratanapiboon, K. An empirical approach for predicting kinematic viscosities of biodiesel blends. Fuel89(10), 2775–2780 (2010). [Google Scholar]
- 32.Yoon, S. H., Park, S. H. & Lee, C. S. Experimental investigation on the fuel properties of biodiesel and its blends at various temperatures. Energy Fuels22(1), 652–656 (2008). [Google Scholar]
- 33.Fu, L., Wang, J., Fu, X. & Zhao, G. Finite-time Pade-based adaptive FNN controller implementation for microbial fuel cell with delay and multi-disturbance. Int. J. Hydrog. Energy98, 1034–1043 (2025). [Google Scholar]
- 34.Zarifi, A., Madani, M. & Jafarzadegan, M. Auto-tuning PVT data using multi-objective optimization: Application of NSGA-II algorithm. Petroleum10(1), 135–149 (2024). [Google Scholar]
- 35.Bemani, A., Baghban, A. & Mohammadi, A. H. An insight into the modeling of sulfur content of sour gases in supercritical region. J. Pet. Sci. Eng.184, 106459 (2020). [Google Scholar]
- 36.Bemani, A., Baghban, A., Mohammadi, A. H. & Andersen, P. Ø. Estimation of adsorption capacity of CO2, CH4, and their binary mixtures in Quidam shale using LSSVM: Application in CO2 enhanced shale gas recovery and CO2 storage. J. Nat. Gas Sci. Eng.76, 103204 (2020). [Google Scholar]
- 37.Razavi, R., Bemani, A., Baghban, A., Mohammadi, A. H. & Habibzadeh, S. An insight into the estimation of fatty acid methyl ester based biodiesel properties using a LSSVM model. Fuel243, 133–141 (2019). [Google Scholar]
- 38.Madani, M., Abbasi, P., Baghban, A., Zargar, G. & Abbasi, P. Modeling of CO2-brine interfacial tension: Application to enhanced oil recovery. Pet. Sci. Technol.35(23), 2179–2186 (2017). [Google Scholar]
- 39.Abdi-Khanghah, M., Bemani, A., Naserzadeh, Z. & Zhang, Z. Prediction of solubility of N-alkanes in supercritical CO2 using RBF-ANN and MLP-ANN. J. CO2 Util.25, 108–119 (2018). [Google Scholar]
- 40.Hasanzadeh, M. & Madani, M. Deterministic tools to predict gas assisted gravity drainage recovery factor. Energy Geosci.5(3), 100267 (2024). [Google Scholar]
- 41.Mehralizadeh, A., Shabanian, S. R. & Bakeri, G. Investigation of boiling heat transfer coefficients of different refrigerants for low fin, Turbo-B and Thermoexcel-E enhanced tubes using computational smart schemes. J. Therm. Anal. Calorimet.141(3), 1221–1242 (2020). [Google Scholar]
- 42.Shabanian, S. R., Lashgari, S. & Hatami, T. J. Application of intelligent methods for the prediction and optimization of thermal characteristics in a tube equipped with perforated twisted tape. Appl. Part A70(1), 30–47 (2016). [Google Scholar]
- 43.Bemani, A., Kazemi, A., Ahmadi, M., Yousefzadeh, R. & Moraveji, M. K. Rigorous modeling of frictional pressure loss in inclined annuli using artificial intelligence methods. J. Pet. Sci. Eng.211, 110203 (2022). [Google Scholar]
- 44.Bemani, A., Kazemi, A. & Ahmadi, M. An insight into the microorganism growth prediction by means of machine learning approaches. J. Pet. Sci. Eng.220, 111162 (2023). [Google Scholar]
- 45.Bemani, A., Madani, M. & Kazemi, A. J. F. Machine learning-based estimation of nano-lubricants viscosity in different operating conditions. Fuel352, 129102 (2023). [Google Scholar]
- 46.Khamehchi, E. & Bemani, A. J. M. Prediction of pressure in different two-phase flow conditions: Machine learning applications. Measurement173, 108665 (2021). [Google Scholar]
- 47.Soltanian, M. R. et al. Data driven simulations for accurately predicting thermodynamic properties of H2 during geological storage. Fuel362, 130768 (2024). [Google Scholar]
Associated Data
This section collects any data citations, data availability statements, or supplementary materials included in this article.
Supplementary Materials
Data Availability Statement
Data file is available as a supplementary file.