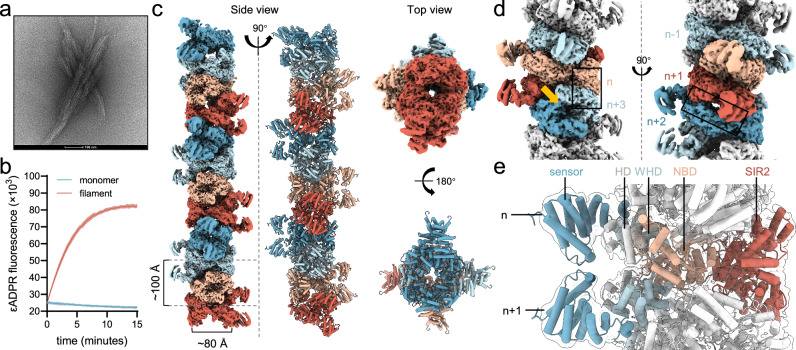
Fig. 2. Cryo-EM structure of the EfAvs5 filament.
a Negative-stain micrograph images of EfAvs5, representative of >5 fields of view with similar results. The scale bar represents 100 nm. b EfAvs5’s NADase activity is activated by filamentation. After the addition of ε-NAD+, total fluorescence was measured over time. Data represent the mean of three replicates, and shaded regions represent the SEM. c Top and side views of the density map and the atomic model of EfAvs5 filament. d Detailed view of EfAvs5 filament to show the subunit interfaces. Two interfaces are indicated with boxes, and the NAD+ active site is indicated with an orange arrow. e The core of EfAvs5 filament is composed of the SIR2 domain and the NOD. Source data are provided as a Source Data file.

