

Abstract
Genotoxic estrogen metabolites generate various DNA lesions; however, their target genes and carcinogenic mechanisms remain unexplored. Here, genome-wide sequencing using click probe enrichment coupled with liquid chromatography-tandem mass spectrometry (Click-Probe-Seq/LC-MS2) is developed to identify damaged genes and characterize the released and stable adducts induced by 4-hydroxy-17β-estradiol (4OHE2) in MCF-7 cell chromatin. The data reveal that guanine nucleobases in the GC-rich transcription-relevant domain are the main target sites. Moreover, the damage abundance positively correlates with DNase hypersensitive sites, suggesting that 4OHE2 preferentially attacks accessible chromatin regions beyond the estrogen receptor (ER) binding sites. Cell-based studies indicate that accumulated 4OHE2 suppresses gene transcription, causes ineffective damage repair, and decreases cell viability, differing from the uncontrolled cell growth caused by extensive ER signaling. The Click-Probe-Seq/LC-MS2 approach reveals the first chromatin damage map induced by an endogenous metabolite, exposing a previously unexplored landscape in cancer research that is applicable to other genotoxic species.
Subject terms: Chemical tools, Chemical modification
Using a click probe-Seq/LC-MS/MS approach, this study reveals the first chromatin damage map caused by an endogenous estrogen metabolite, exposing a previously unexplored landscape in cancer research.
Introduction
Normal mammalian metabolism of amino acids, lipids, nucleotides, and hormones can generate highly reactive endogenous intermediates such as aldehydes1,2, quinones3, and other alkylating agents4,5 which form various covalent bonds with DNA. Although natural repair systems can repair such modifications to recover DNA function, extensive endogenous mutagens/carcinogens resulting from imbalanced homeostasis may decrease the tolerability of the repair system to exogenous carcinogens and increase the risk of spontaneous tumor development. Such a hypothesis has been elaborated in previous studies4–7, but the lack of a quantitative experimental approach has limited its further exploration. 4-hydroxy-17β-estradiol (4OHE2) is a type of catechol estrogens (CEs) and one of the most genotoxic metabolites of estrogen hormone8. Accumulated 4OHE2 can damage DNA by forming 4-hydroxyestradiol-N7-guanine (4OHE2-G) or 4-hydroxyestradiol-N3-adenine (4OHE2-A) adducts9,10, leaving apurinic (AP) sites which can lead to DNA strand breaks or interstrand DNA crosslinks to block transcription or cause mutations during error-prone repair3,11,12. Furthermore, stable bulky adducts of 4-hydroxy-17β-estrone and 4OHE2, corresponding to alkylation of guanine (Gua) nucleobase, have been detected in human breast tumor tissue by nano liquid chromatography-nano electrospray tandem mass spectrometry (nano-LC-nanoMS2) with multiple reaction monitoring (MRM)13. If not adequately repaired, such bulky DNA adducts can induce double-strand DNA breaks (DSB) and genomic rearrangements, leading to cell death or cancer development3. Since many exogenous carcinogens, such as environmental pollutants 2,3,7,8-tetrachlorodibenzo-p-dioxin, can affect P450 isozymes14 that act to metabolize hydroxylated estrogens, including 4OHE2, one’s genotoxic risk and mechanistic basis for tumor incidence could therefore be assessed in terms of the DNA damage by 4OHE2. However, the target genes of estrogen metabolites are not yet identified; therefore, the genotoxic effects have been widely attributed to overlapping mechanisms of extensively studied hormonal pathway15–18. In this pathway, estrogen stimulates cell proliferation through nuclear estrogen receptor (ER)-mediated signaling.
With the advent of faster and cheaper sequencing platforms, it is now possible to assess damage or mutation in experimental models across the whole genome19–23 and even detect alterations with single nucleotide resolution by DNA polymerase stalling technique20,21. Immunoprecipitation followed by amplification of enriched fragments has been applied to evaluate DNA damage profiles either indirectly using antibody against the nucleotide excision repair (NER) complex22 or directly using antibody against the toxic chemicals such as activated benzo[a]pyrene21. Alternatively, by derivatizing oxidatively damaged 8-oxo-7,8-dihydroguanine (8-oxoGua) sites with a biotin tag, affinity purification has been shown to map 8-oxoGua sites in the mouse genome by next-generation sequencing (NGS) at ∼0.15-kb resolution23. Compared to immunoprecipitation using bulky antibodies, affinity purification using small chemical tags can reduce potential alteration on DNA secondary structures and increase sequencing resolution. Affinity purification using a biotin-tagged chemical entity called Chem-seq has been used to map the direct interactions of the tagged chemical with chromatin to gain insights into chemical perturbation of cellular function24. A similar technique called chromatin affinity-precipitation (ChAP) has been used to detect the chromatin fragments where small molecules interact with binding partners25. These approaches were to pulldown non-covalent interaction partners by affinity purification. For covalent pulldown, extremely close proximity between the probe and its target is essential for inducing covalent bonding. Two-step affinity purification using a small tagged probe for interaction, followed by a bulky affinity linker for pulldown, can minimize tag-induced structural alteration or hindrance and is an excellent method for covalent pulldown. Additionally, click chemistry, which utilizes relatively small and inert tags, offers biorthogonal functionalization26 to enable flexible linker designs for two-step affinity purification.
Here a click probe of 4OHE2, 4-hydroxy-17α-ethynyl-17β-estradiol (4OHEE2), was used to develop two-step affinity purification for genome-wide sequencing by NGS (Click-Probe-Seq) to map 4OHE2-induced damage in chromatin of MCF-7 cells. However, unlike the stable 4OHE2 protein adducts previously identified by quantitative proteomics27,28, complicated products, including released and stable adducts, are generated upon interaction with DNA3,9–12. It is necessary to characterize the global generation profile of not only the stable but also released DNA adducts by MS21,29. Although the global levels of damage may not indicate how damage maps may alter, the global view and dose/time-response relationship can be used to correlate with the pulldown sequencing results and give better interpretation of the data. Given the direct link between excessive exposure to estrogens, CEs adduct markers, and increased risk of cancers30–33, it is crucial that the target genes of genotoxic metabolites versus binding genes of ER34,35 and factors that lead to tumor formation be thoroughly explored.
Results
Study design
A combined workflow of Click-Probe-Seq/LC-MS2 (Fig. 1a) using a 4OHEE2 probe with an alkyne group at C17α of 4OHE2 was designed for this study. We conducted this study with isolated chromatin complex comprising genomic DNA, histone proteins, and associated regulatory proteins trapped by formaldehyde crosslinking to yield better detection sensitivity. Quantitative capillary LC-nanoMS2 analysis was carried out simultaneously with pull-down assay to characterize the global formation profiles of the released and stable DNA adducts. Chem-seq using biotinylated chemical probes was previously shown to yield essentially similar genomic sites from cell lysate as from live cells24. However, the damage level of genomic DNA is affected by chemical reactivity, chromatin structure, chromatin structural changes induced repair mechanisms, and others. Both calf thymus DNA and MCF-7 cells were exposed to 4OHEE2 to investigate these effects. The resulting adducts were characterized globally as references for damage induced without chromatin packing (calf thymus DNA) and in the presence of DNA repair (cell exposed), respectively. Finally, time/dose-dependent functional comparability studies of a panel of target genes identified by Click-Probe-Seq/LC-MS2 were conducted using cultured live cells to reveal the damage-repair interplay. Functional outcomes induced by 4OHE2, 4OHEE2, and the parent estrogen 17β-estradiol (E2) were also compared.
Fig. 1. Global DNA adduct generation detected by LC-MS2.

a Combined workflow of Click-Probe-Seq and LC-MS2. b Extracted ion chromatograms (XICs) of the stable deoxyguanosine adduct (4OHEE2-dG, indicated in blue) detected in the pellet hydrolysate and released guanine adduct (4OHEE2-G, indicated in orange) detected in the supernatant. Quantification results are shown on the right for samples treated with DMSO (control) or 30 μM and 300 μM 4OHEE2 (Exp). Error bar indicated SD based on three repeated experiments (n = 3). c Time course study of chromatin DNA treated with 300 μM 4OHEE2. d MS2 of 4OHEE2-G (m/z = 462). e MS2 of 4OHEE2-dG (m/z = 578). Proposed structures are annotated in the insets.
Global adduct generation profiles
In-situ generation of 4OHEE2 quinone was achieved by the oxidation of 4OHEE2 using MnO2, followed by immediate incubation with the chromatin complex for 24 h to induce DNA adducts (online Method under In-situ generation of CE quinone and adduct formation). After precipitation, the supernatant containing the released adducts was collected directly; the pellet containing stable DNA adducts was subjected to protein digestion and DNA extraction, and then hydrolyzed into nucleosides (Fig. 1a). Adenine (Ade) and Gua are the two primary nucleobase targets of 4OHE2/4OHEE2, quantitative capillary LC-nanoMS2 using the MRM method was developed to target released Gua (4OHEE2-G) and Ade (4OHEE2-A) adducts as well as stable deoxyguanosine (4OHEE2-dG) and deoxyadenosine (4OHEE2-dA) adducts (online method). All the adduct standards were separated within 12–14 min (Supplementary Fig. 1), and the method was validated (Supplementary Table 1). However, the results (Fig. 1b) indicated that only 4OHEE2-G eluted at 13.3 min and 4OHEE2-dG eluted at 12.3 min were detected in the supernatant and pellet hydrolysate, respectively. Quantification based on calibration curves (Supplementary Fig. 2) indicated that about 0.65 μg 4OHEE2-G and 0.18 μg 4OHEE2-dG were generated per gram of total chromatin DNA. These measurements were obtained from ~100 μg of chromatin DNA treated with 300 μM of the 4OHEE2 probe. When treated with 30 μM 4OHEE2, the amount of 4OHEE2-G in the supernatant was 10 times lower (~0.05 μg/g). That of 4OHEE2-dG in the pellet was only three times lower (~0.06 μg/g), yielding a relatively higher percentage of stable adducts in the pellet at lower dosages (right of Fig. 1b). Additionally, trace amounts of 4OHEE2-G were detected in the pellet after DNA hydrolysis (Fig. 1b), indicating that the depurination may not have completed before hydrolysis and that the pulldown DNA may also contain AP sites. However, no adducts generated from Ade (4OHEE2-A or 4OHEE2-dA) were detected in chromatin DNA (Supplementary Fig. 3). The absence of Ade adducts could be due to lower accessibility to Ade than to Gua. Gua normally has a relatively higher percentage in chromatin-accessible regions (higher GC%) such as the promoter (see later results). Additionally, Ade has lower nucleophilicity and thus lower reactivity as compared to Gua36. Moreover, the far more rapid loss of estrogen-Ade adducts compared to estrogen-Gua adducts10,37,38 could lead to the lack of 4OHEE2-A or 4OHEE2-dA remaining in DNA. Other damage forms such as cross-linked DNA or adduct conjugates may be associated with such fast kinetics and remain un-identified.
For comparison, adducts generated from calf thymus DNA by 24-h incubation with 4OHEE2 (300 μM) were examined (online method). Previous studies have observed approximately equal amounts of 4OHE2-G and 4OHE2-A adducts released from calf thymus DNA at different depurination speeds10,37. Here, we observed approximately 1-2 times more 4OHEE2-A than 4OHEE2-G in the supernatant and approximately 10 times more 4OHEE2-dA than 4OHEE2-dG in the pellet hydrolysate of calf thymus DNA (Supplementary Fig. 4). Moreover, multiple peaks with the same precursor/fragment ion pair, but slightly different retention times, were detected, implying the presence of isomers. These results differ from those of the Gua adducts (4OHEE2-G or 4OHEE2-dG), which were detected as single transition peaks in chromatin DNA. These differences suggest that histone wrapping protects chromatin DNA from carcinogenic attacks beyond chemical reactivity. To the best of our knowledge, this is the first characterization of 4OHE2-induced chromatin DNA damage and the first to reveal different 4OHE2 adduct profiles generated from chromatin DNA versus purified DNA.
We also quantified stable adducts (4OHE2-dA/dG) in the chromatin DNA resulting from the exposure of cells to 4OHE2 (online method). After treating MCF-7 cells with 4OHE2 (30 μM) for 24 h, chromatin DNA was extracted, enzymatically hydrolyzed, and analyzed by LC-MS2 (Supplementary Fig. 5) as a reference for global damage in the presence of cellular repair system. Unlike the results from calf thymus DNA, in which appreciable amounts of both 4OHEE2-dA and -dG adducts were detected, only 4OHE2-dG, but not 4OHE2-dA, could be detected in cell-treated chromatin. This was, however, consistent with the results deduced from the direct incubation of 4OHEE2 with the extracted chromatin, indicating a similar global damage profile for chromatin DNA in the presence (cell) or absence (extracted chromatin) of damage-induced cell repair system.
Time course study of chromatin adducts induced by treatment with 300 μM 4OHEE2 (Fig. 1c) indicated that 4OHEE2-G was released to the supernatant after 30-min incubation and reached a plateau at 10 h. This is consistent with the report10,37 that 4OHE2-G released slowly from calf thymus DNA and reached completion in 10 h under 37 °C. A stable adduct (4OHEE2-dG) was detected in the hydrolyzed pellet after 5-h incubation and remained stable for up to 24 h. This indicates that, regardless of depurination, 4OHEE2-dG generated at a slower speed can be stably pulled down if the incubation time is >5–10 h. Although the MS2 spectrum of 4OHEE2-G (Fig. 1d) did not provide enough fragments to assign the exact adduction sites, the spectrum was annotated as 4OHEE2-1-N7G with covalent binding between N7 of Gua and C1 of the 4OHEE2 A-ring, as previously reported for 4OHE2-G10. For 4OHEE2-dG (Fig. 1e), we suspected there could be different co-fragmented isomers (eluted simultaneously). The m/z = 462 fragment [M-ribose+H]+ resulting from the breaking of the N-glycosyl bond, was likely generated from non-dissociated 4OHEE2-1-N7G (left inset of Fig. 1e) due to slow kinetics. The m/z = 268 fragment [M-4OHEE2 + H]+ resulting from breaking the 4OHEE2-deoxyguanosine linkage without losing ribose, was likely from adducts with stable covalent bonds between the C1 A-ring of 4OHEE2 and exocyclic oxygen (right inset of Fig. 1e) or exocyclic amine37 on dG. However, the m/z = 462 fragment could also be generated from stable isomers; the m/z = 152 internal fragment (Gua) could be generated by either non-dissociated 4OHEE2-1-N7G or stable isomers. We were unable to identify the structure that dominated the 4OHEE2-dG product based on MS2. However, since only trace amounts of 4OHEE2-G were released during DNA hydrolysis (Fig. 1b), the 4OHEE2-dG detected in the pellet may mainly contain stable covalent adducts. Regardless of non-dissociated 4OHEE2-G or stable 4OHEE2-dG, the click probe pulled down genes damaged by 4OHE2/4OHEE2 via covalent bonding.
Click-Probe-Seq and DHS site mapping
Two-step affinity purification (Fig. 2a) was carried out to pull down 4OHEE2-damaged DNA from the treated (30 μM 4OHEE2) chromatin and the control (DMSO) using a disulfide-cleavable azide/biotin linker, followed by affinity purification using streptavidin beads. Pull-down DNA was released from the beads by DTT reduction and dehybridized to dissociate into two single strands for sequencing by mapping to the human genome. Based on LC-MS2 characterization, the pulldown DNA samples were expected to contain 4OHEE2-complexed AP sites or bulky 4OHEE2 adducts (Fig. 2a). Oxidized DNA induced by 4OHE2-generated reactive oxygen species39 may also be present in pulldown sequences if catechol/quinone redox cycling occurs near the 4OHE2/4OHEE2 adduction sites. Although the adducts (e.g., stable adducts, AP sites arising from depurination, and crosslinks arising from AP sites) may interfere with the efficiency of NGS, the intact complementary strands dehybridized from these damaged strands (Fig. 2a) could increase the sequence coverage because of the lack of bulky modifications to stall DNA polymerase function.
Fig. 2. 4OHEE2 Click-Probe-Seq by NGS and DHS site mapping.

a Schematics of the two-step affinity pulldown with the control and 30 μM 4OHEE2 treated chromatin complex. b Gel images of pulldown/control experiments. c The enriched genomics map of ST14, KIF23, and ZNF 709. d Correlation of the reported DHS map (purple) and pulldown NGS results (red). The log2 (average folds of peak enrichment in 100 kb bins) values were correlated to the log2 (coverage of DHS in 100 kb bins) values. The mirror image maps of Chr11, Chr15, and Chr19 with location of ST14, KIF23, and ZNG709 in respective chromosome were shown in the inset.
Gel image obtained from the control and experimental pair confirmed the pull-down of damaged DNA from the treated chromatin fragmented by MNase with an average length of 150 bp (Fig. 2b). The pooled DNA samples (10 ng) from three replicates were subjected to NGS analysis conducted on an Illumina NovaSeq instrument (151 cycles of paired-end reads). NGS reads from the control (61,016,498 reads), and experimental (165,420,148 reads) groups were aligned to the reference human genome (GRCh38), and 93% from the control and 82% from the experimental group were successfully mapped to the reference genome. The control reads provided background information to deduce the fold changes in the peaks (Exp/Control). 13,935 peaks were enriched >1.36 folds and q < 0.05, corresponding to 8103 genes (Supplementary Data 1). The gene map showed highly enriched peaks (Fig. 2c) in the promoter regions of KIF23 (fold change 9.06), ST14 (fold change 8.09), and ZNF709 (fold change 9.02).
The average fold changes of identified peaks were mapped genome-wide to the density map of DNase hypersensitive sites (DHS) of non-treated MCF-7 cells40 with a positive (coefficient =0.35) correlation (Fig. 2d). DHS sites represent the generally accessible chromatin landscape of the human genome. The results indicated that 4OHEE2 targets these accessible regions of chromatin DNA. Regions with a high population and more significant fold changes by Click-Probe-Seq (dark red) are also regions with highly clustered DHS sites (dark purple). A mirror-imaged DHS/Click Probe-Seq population map is shown for Chr11, Chr15, and Chr19 (inset of Fig. 2d). Moreover, the two highly enriched peaks in the promoter regions of KIF23 and ZNF709 were also high DHS-density regions of Chr15 and Chr19, respectively. Another highly enriched peak in the promoter region of ST14 (fold change 8.09) was observed at a local maximum of DHS sites on Chr11. Since a promoter is a region of DNA upstream of a gene where transcription-relevant proteins such as RNA polymerase and transcription factors bind, the promoter region is exposed to initiate gene transcription. In contrast, genes located in some regions not enriched by Click-Probe-Seq, such as the 5′ terminal of chr 13, 14,15, 21, and 22, are also not high DHS density sites. For example, BRCA2 gene located in the buried 5′ terminal of chr 13 was not enriched by Click-Probe-Seq (Fig. 2d).
Sequence and bioinformatics analysis of damaged genes
It has been proposed that ERα, which is activated by binding to the parent estrogen E2, may play a role in 4OHE2-induced carcinogenesis through the “Trojan horse” mechanism15. ERα may bind to 4OHE2 and carry it directly to bind to estrogen-responsive element (ERE) contained in the promoter region of estrogen responsive genes41 to damage DNA. This hypothesis is supported by the high affinity (80% of E2) of 4OHE2 to ERα42 and significantly higher 4OHE2-induced DNA damage in cells expressing ERs than in cells not expressing ERs15. Examining the sequences of all enriched peaks (Fig. 3a), we found that approximately 50% of the enriched peaks contained half the ERE sequence (GGTCA or TGACC), but only eight peaks contained the full ERE sequence (GGTCAnnnTGACC). In the promoter region (Fig. 3b), among the 4147 enriched peaks, as determined by filtering peaks located in promoters (Supplementary Data 1), approximately 47% of enriched peaks contained half the ERE sequence (GGTCA or TGACC), but only two enriched peaks contained the full ERE sequence (GGTCAnnnTGACC). These results indicate that the 4OHE2-DNA interaction may occur beyond the αER-mediated pathways. In fact, the highly enriched peaks of KIF23 and ST14 did not contain the ERE sequence; ZNF709 contained two half sequences (GGTCA or TGACC) but not the full ERE sequence (GGTCAnnnTGACC).
Fig. 3. Bioinformatics and sequence analysis of the identified target genes.

Distribution of ERE containing genes from a, all enriched peaks (fold change >1.4) and b, promoter enriched peaks. c Distribution of GC% with fold changes (left) and with distribution of genomic element (right). d GO annotation enriched from all 8100 identified genes (top) and 2400 promoter-enriched genes (bottom) using DAVID bioinformatics database (v6.8).
The distribution of genomic elements (GE) and the nucleotide contents of the enriched peaks were compared with those of random hits from the control. We found that the GC% of the enriched peaks increased with fold-change (left of Fig. 3c): ~67% with a fold-change >5 and ~47% with a fold-change <1.36. Among the >2-fold enriched peaks, the GC% of their sequences was determined to be >63%, which was much more significant than 47.33 GC% of the control reads. This result is consistent with the LC-MS2 results, which indicated that Gua nucleobase is the primary target of 4OHEE2/4OHE2 rather than Ade nucleobase. The GE distribution (right of Fig. 3c) of enriched peaks were inspected, including promoters, 5′-UTRs, 3′-UTRs, exons, introns, downstream, and distal intergenic regions. The enrichment factor (columns D and G) of each GE was calculated by dividing the fraction of enriched peaks (B) or GC% (E) by the fraction of mapped reads (C) or GC% (F) in the corresponding controls. The overall GC% enrichment factor (H) for a specific GE was calculated by multiplying the enrichment factors of the GE and GC%. The results showed that the intergenic (enrichment factor = 0.66) and intron regions (enrichment factor = 0.63) provided fewer peaks than would be predicted if the enriched peaks were randomly distributed. This is consistent with the fact that the intergenic regions are protected by heterochromatin to safeguard them from oxidation. In contrast, promoters (enrichment factor = 4.52), 5′-UTRs (enrichment factor = 4.19), 3′-UTRs (enrichment factor = 2.07), and exon regions (enrichment factor = 2.78) provided more significant relative numbers of enriched peaks than expected by a random distribution of the peaks throughout the genome. The enriched peaks in the promoter region also had a higher GC% of 69.45% compared to the 55.33% observed in the mapped promoter reads from the control (enrichment factor = 1.26). These data strongly suggest that 4OHE2 preferentially interacts with the GC-rich sequences in the target genes’ promoter, exon, and UTRs regions, with a 5.70-fold greater chance than that expected by a random hit throughout the genome. Moreover, these results are consistent with the GO annotation (Fig. 3d) that sequence-specific double-strand DNA binding and RNA polymerase II transcription factor activity are the two most enriched molecular functions from either all 8100 identified genes or 2400 identified genes with enriched peaks containing the promoter region.
Comparison of gene transcription induced by 4OHE2/4OHEE2 versus E2
The damage map derived by Click-Probe-Seq/LC-MS2 served as a guide of target genes to conduct functional studies with live cells. We are aware of the dynamic nature of cellular DNA/chromatin and damage map. Once extracted, damage-induced repair mechanisms and structural changes will not occur in extracted chromatin. Moreover, repair-directed other DNA lesions may affect chromatin structure, and hence damage map, which is not present in extracted chromatin. Also, the map might be influenced by the dose that actually reaches the DNA/chromatin rather than the treated dose. However, our goal was to first study the direct molecular effects of estrogen on chromatin in a controlled ex vivo system. While extracted chromatin does not fully replicate in vivo dynamics, it offers a useful model for examining specific molecular interactions by taking native chromatin structure into consideration. Once the DNA repair function is initiated, the chromatin is reshaped, and we expect the damage level of the target genes to decrease. Carcinogen-accessible open chromatin may also be more accessible to the repair machinery than closed chromatin.
Since transcription was the main molecular function enriched from damaged genes, RT-PCR experiments were performed with MCF-7 cells grown in 1% FBS to compare the transcription of a panel of identified target genes induced by treatment with 30 μM 4OHEE2, 4OHE2 or E2 for 24 h. In general, the transcription of all the examined target genes appeared to be either suppressed or unchanged by 4OHEE2 or 4OHE2 treatment, regardless of whether they were E2-responsive or non-responsive. For example, E2 treatment significantly increased the transcription level of GREB1 (p < 0.01) (Fig. 4a), an E2 responsive and ERE-containing gene, but did not affect the transcription level of KIF23 (Fig. 4b), a non-ERE-containing gene. However, compared to E2 treatment, significantly decreased expression levels were induced by 4OHE2 or 4OHEE2 treatment (p < 0.01), irrespective of transcription of GREB1 or KIF23. Specifically, 24-h 4OHE2 or 4OHEE2 treatment did not alter the transcription level of GREB1 compared to controls but significantly decreased the transcription level of KIF23 (p < 0.01). Note that treatment with E2, 4OHE2, or 4OHEE2 did not change the transcription of the housekeeping gene GADPH (Fig. 4c), which is also not a target gene of 4OHEE2. GREB1 and KIF23 levels were normalized to GAPDH as an internal control. (Fig. 4a, b). In addition to GREB1 and KIF23, the transcription of MYC and NCOA3 remained unchanged (Supplementary Fig. 6), and the transcription of BRCA1 and RAD51 (discussed later) was suppressed after 24-h treatment with 4OHE2 or 4OHEE2. We conclude that the transcription of target genes will likely be suppressed by 4OHE2 or 4OHEE2 in the long run, regardless of ERα-targeting or non-ERα-targeting genes. Furthermore, 4OHEE2 and 4OHE2 exhibited similar transcription patterns for the target genes, indicating that the damage map deduced by 4OHEE2 click probe could be used to predict 4OHE2 signaling.
Fig. 4. Comparability study of transcriptional changes induced by 4OHE2, 4OHEE2, and E2.
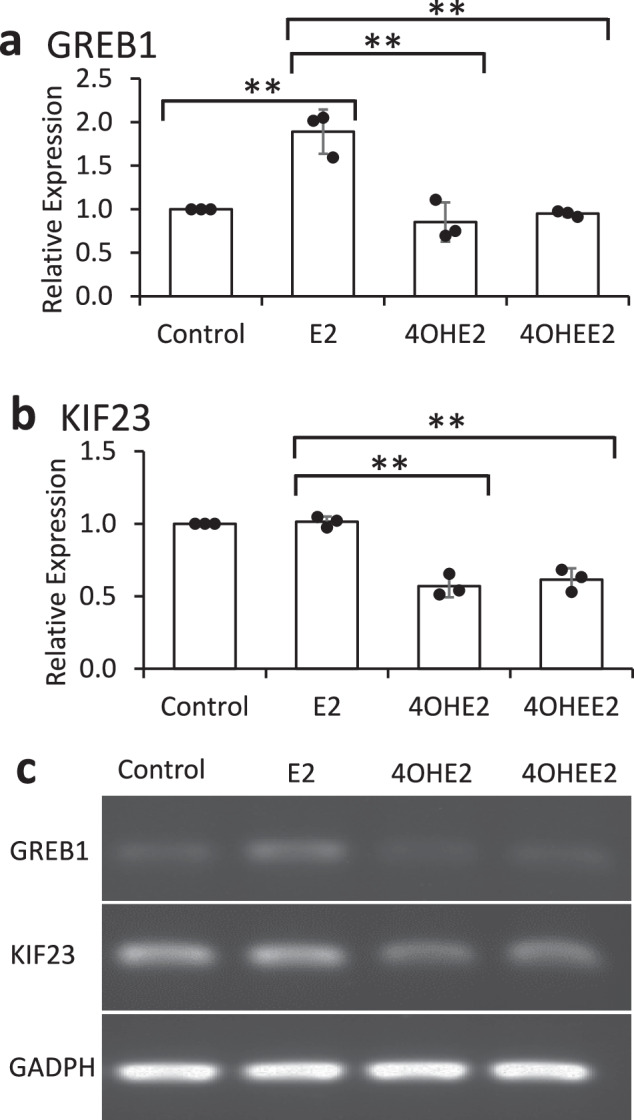
RT-PCR results for a ERE-containing gene GREB1 and b non-ERE-containing gene KIF23. c The gel images of GREB1 and KIF23 as well as the housekeeping gene GADPH. All treatments were at the dosage of 30 μM under a 24-h incubation of MCF-7 cells cultured in 1% serum. Error bars show standard deviations. Statistical analysis was conducted by a two-tailed unpaired Student’s t test. **P < 0.01, significantly different between control and E2, and between E2 and 4OHE2/4OHEE2, with three replicates (n = 3).
4OHE2/4OHEE2- versus E2-induced DNA damage and repair
In contrast to DNA damage caused by the covalent interaction of CEs with DNA, E2 is known to induce double-strand breaks (DSBs) through R-loops43 formed during regulated transcription43,44. Immunofluorescence of γH2A, which serves as a marker indicating the initial cellular response to DNA DSBs, revealed that significant DSBs were induced by both the parent estrogen E2 and 4OHE2 or 4OHEE2 (Fig. 5a). A time-course study further revealed the differential damage profiles of DSBs induced by E2 versus 4OHE2 or 4OHEE2. In general, significant levels of DSBs (>50%) were induced during the first 12-h incubation of each treatment with differential peak times (Fig. 5b). Among the three treatments, 4OHEE2 caused the highest damage percentage (>70%) at 3-h, E2 caused the highest damage percentage (>75%) at 6-h, and 4OHE2 again caused the highest damage percentage (>68%) at 12-h. Damage levels decreased in all treatments at 24-h. Yet, at 24-h, E2 treatment resulted in a damage level of less than 5%, which was more than five times lower than that induced by 4OHE2 (~ 25%) or 4OHEE2 ( ~ 30%) (Fig. 5b). This indicates that while similar extents of DSBs could be induced by E2, 4OHE2, or 4OHEE2 through different mechanisms, the accumulated damage from 4OHE2 or 4OHEE2 can overwhelm or disrupt the repair machinery, making it less effective at managing the damage compared to the damage caused by E2 treatment.
Fig. 5. Comparability time course studies of DSB damage and repair of MCF7 cells treated with 4OHE2, 4OHEE2, or E2.

a γH2A immunofluorescence with b statistics of the ratio of damaged cells (stained) versus the total cells. Scale bar: 30 µm. RT-PCR expression of HRR genes of c BRCA1 and d RAD51C. All treatments were 30 μM and under a 24-h incubation of MCF-7 cells cultured in 1% serum. Error bars show standard deviations from three replicates. Statistical analysis was conducted by a two-tailed unpaired Student’s t test. *P < 0.05 and **P < 0.01, significantly different from control.
DSBs are mainly repaired by homologous recombination repair (HRR) pathways45 and estrogen is a master regulator of HRR gene expression43,46–48 including BRCA1 and BRCA2, whose mRNA are coordinately elevated by E2 mediated ER signaling47. Moreover, BRCA1 deficiency exacerbates DNA damage and genomic instability induced by estrogen and estrogen metabolites48. BRCA1 was identified by Click-Probe-Seq with enhanced peaks covering the promoter region. In contrast, BRCA2 was not identified as it is located in a buried site (Fig. 2d). RAD51C, another estrogen-induced HRR gene49, was also identified by click probe sequencing with enhanced peaks covering the promoter region. This gene is localized to a region (chromosome 17q23) where amplification occurs frequently in breast tumors49. Time course RT-PCR results showed that the expression of BRCA1 (Fig. 5c) and RAD51C (Fig. 5d) increased shortly after 3 h of E2 treatment (p < 0.05) but then decreased and returned to control levels within 24 h. However, their transcription levels also increased shortly after a 3-h treatment with 4OHE2 or 4OHEE2 (p < 0.05) but were substantially suppressed at 24-h (p < 0.01). These results were consistent with γH2A immunofluorescence, indicating that ineffective repair processes may occur to accumulate 4OHE2/4OHEE2-induced DSBs owing to mutations or deficiencies in genes encoding proteins involved in DNA repair. These results further suggest that DNA damage levels are dynamic and change with time and dosage, depending on the repair mechanism.
Comparability studies of cell viability
Severe or impaired DNA damage may affect normal cell growth. The effects of E2, 4OHE2, and 4OHEE2 on the viability and morphology of MCF7 cells at 24-h post-exposure to various concentrations (0–10%) of serum nutrients are summarized (Fig. 6). Abnormal cell growth was observed at low concentrations (0 or 1%) of serum in each treatment (Fig. 6a). Cells appeared to be more tightly packed together (Fig. 6b), with increased cell viability following E2 treatment compared to control cells (P < 0.01). In contrast, cells appeared to undergo morphological changes (Fig. 6b), with decreased cell viability following 4OHE2 or 4OHEE2 treatment compared to the control cells (P < 0.01). These results indicate different outcomes of E2 versus 4OHE2 or 4OHEE2 treatment, in which DSB was induced in cells under nutrient-deprived conditions. The suppression of transcriptional regulation and ineffective repair of DNA damage caused by 4OHE2 or 4OHEE2 may decrease cell viability. The less severe impact on transcription and more manageable DNA damage caused by E2 may enhance cell viability by activating ERα signaling. The results further indicate that cells can be protected from the effects of 4OHE2 or 4OHEE2 at concentrations up to 30 µM for 24 h, as long as serum nutrient levels are maintained above 5%. Moreover, more than half of the cells remained viable even with 1% serum (Fig. 6a) when treated with 30 µM of 4OHE2 or 4OHEE2. Investigating whether such malignant growth conditions lead to cellular transformation into disease states would be interesting16.
Fig. 6. Effect of MCF-7 Cell viability by treatment with 4OHE2, 4OHEE2, or E2.

a Statistics of cell viability (%) under cells cultured by 0–10% serum, and b the morphology changes of the cells grown under 1% serum. All treatments were 30 μM and under a 24-h incubation. Error bars show standard deviations from three replicates. Statistical analysis was conducted using a two-tailed unpaired Student’s t test. *P < 0.05 and **P < 0.01, significantly different from control.
Discussion
Estrogen is a crucial hormone in the human body that plays vital roles in various physiological processes. Estrogen primarily exerts its effects through its action on ERs via the genomic pathway, in which the estrogen-ER complex binds to EREs to initiate the transcriptional machinery, leading to an increase or decrease in the transcription of specific genes41. Although estrogen can also exert rapid, non-genomic effects50 through membrane-associated receptors to activate cellular responses, this process is independent of direct gene transcription. During ERα-dependent transcription, DNA damage can be induced through R-loops43, which are required for transcriptional activities such as transcription termination, gene regulation, and DNA repair. In normal cellular processes, DSBs induced by R-loops at the promoters of some estrogen-responsive genes can be effectively repaired by HRR pathways because estrogen is a master regulator of HRR gene expression42,43,46. Although 4OHE2 molecules can exhibit similar estrogenic actions and R-loops by binding to the ERα, their potency and effects can vary significantly compared to those of the parent estrogen, E2, because 4OHE2 molecules are considered more reactive and potentially harmful owing to their propensity to form DNA adducts. It has been proposed that 4OHE2 is translocated to the nuclei through the ERα and binds to the ERE to exert its redox or adduct-forming activity to damage ER-regulated genes (Trojan horse)15. However, our NGS and DHS mapping data indicate that 4OHE2 mainly targets chromatin-exposed and GC-rich domains regardless of ERα or non-ERα targeting sites. Furthermore, capillary LC-nanoMS2 characterization revealed that 4OHE2/4OHEE2 mainly targeted the Gua nucleobase of chromatin DNA, resulting in AP sites by releasing 4OHEE2-G and forming a significant amount of bulky, stable 4OHEE2-dG adducts on DNA. This differs from previous information derived from purified DNA, which indicated that 4OHE2-G and 4OHE2-A were equally generated by 4OHE210,37, highlighting the potential impact of chromatin regulation on 4OHE2-induced DNA damage.
Our results provide new insights into the novel mechanisms of 4OHE2-induced DNA damage. Sequence analysis and GO annotation indicated enriched peaks were primarily transcriptionally relevant and GC-rich domains. RT-PCR results indicated that 4OHE2 and 4OHEE2 are likely to induce transcriptional suppression of target genes (GREB1, BRCA1, KIF23, and RAD51C) in the long run (24 h), which differs from the transcription suppression induced by E2 under the same conditions. Our data showed that E2 and 4OHE2/4OHEE2 induced DSBs and DNA repair through different mechanisms. Suppressed transcription induced by the accumulated 4OHE2/4OHEE2 caused deficiencies in some target genes encoding proteins involved in DSBs repair (such as BRCA1 and RAD51C), resulting in less effective repair processes for damage induced by 4OHE2/4OHEE2 than for damage induced by E2, mainly through R-loop formation. Finally, the accumulation of 4OHE2/4OHEE2 decreased cell viability, in contrast to the increase in cell viability induced by E2 treatment under nutrient deprivation conditions, which may be explained by different DNA damage and repair mechanisms. Extensive DNA damage resulting from 4OHE2/4OHEE2 adduction may lead to mutations, genomic instability, cell transformation, and eventual death owing to the lack of an effective repair mechanism. In contrast, accumulated DSBs caused by R-loops can be repaired by ER-regulated genes; however, over-activation of ER signaling may lead to uncontrolled cell growth and proliferation.
Although our damage maps were generated based on ex vivo pull-down from the native chromatin complex, comparability results indicated that genome accessibility might not be significantly altered by 4OHEE2 cell exposure, and functional outcomes appear plausible. Once DNA repair was initiated, the damage level was expected to decrease. However, our data identified potential damage genes, helping us to conduct functional studies to reveal the damage-repair interplay. On the other hand, a high dosage (30 µM) of 4OHE2/4OHEE2 had a negligible effect on the growth of MCF-7 cells when cultured in a serum-containing medium, provided that adequate nutrients (>5% serum) were available for cell culture. This finding suggests that the significant DNA damage caused by endogenous metabolites requires long-term accumulation. Nevertheless, a significant proportion of surviving cells (>50%) under low-nutrient conditions (1% serum) may undergo cellular transformation due to malignant growth16. Overall, our results advance our understanding of the diverse mechanisms involved, which is crucial for developing preventive strategies and therapeutic interventions for estrogen-related carcinogenesis.
Conclusion
Here, we report the first comprehensive map of chromatin DNA damage caused by endogenous human metabolites. Unlike exogenous carcinogens, DNA damage caused by endogenous metabolites may be more tightly regulated and have specific biological implications related to normal cellular functions and the capability to handle damage caused by exogenous sources. Taking combined advantages, Click-Probe-Seq/LC-MS2 successfully revealed genome-wide DNA damage induced by 4OHE2, identifying damaged genes, such as BRCA1 and RAD51C, encoding DNA repair. Cell-based comparability studies revealed effective DNA repair due to the suppressed transcription of 4OHE2-damaged genes, which differed from R-loop DNA damage-associated ER signaling. The generated data may be used to conduct studies linking cancer incidence with DNA mutations or cellular transformations caused by accumulated carcinogen exposure, physiological imbalance, or aging. Moreover, the Click-Probe-Seq/LC-MS2 approach can potentially explore a wide range of other covalent DNA damages induced by various chemistries of carcinogens.
Material and methods
Material and reagents
Complete protease inhibitor cocktail was purchased from Roche Life Sciences (Indianapolis, IN, USA). Micrococcal nuclease was obtained from New England Biolabs, Inc (NEB). Trypsin-ethylenediaminetetraacetic acid (EDTA, 0.5%), antibiotic–antimycotic, and fetal bovine serum (FBS) were purchased from Invitrogen (Gibco, Gaithersburg). Azide-SS-biotin (CR3) was obtained from BroadPharm (San Diego, CA). Streptavidin sepharose affinity resin was purchased from GE Healthcare (Chicago, IL). Calf thymus DNA, Proteinase K, Nuclease P1 from Penicillium citrinum (NP1), Deoxyribonuclease I from bovine pancreas type II (DNase I), Phosphatase Alkaline from porcine kidney (ALP), Phosphodiesterase I from Crotalus adamanteus venom (PDE I), tris(3-hydroxypropyltriazolylmethyl)amine) (THPTA), dithiothreitol (DTT), paraformaldehyde, 4-(2-Hydroxyethyl)piperazine-1-ethanesulfonic acid (HEPES), sodium chloride (NaCl), potassium chloride (KCl), manganese dioxide, phenol, chloroform, isoamyl alcohol, bis(2-hydroxyethyl)amino-tris(hydroxymethyl)methane (BIS-TRIS), and Dulbeco were purchased from Sigma-Aldrich (St. Louis, MO, USA). 4-OHE1-1-N7Gua (4OHE1-G), 4-hydroxy-17β-estradiol (4OHE2), and 4-hydroxy-17α-ethinyl-17β-estradiol (4OHEE2), 4-hydroxy-17β-estradiol were purchased from Toronto Research Chemicals (North York, Canada). Polyethylene glycol tert-octylphenyl ether (Triton X-100), glycine were purchased from JT Baker (Center Valley, PA). MS grade acetonitrile (ACN), dimethyl sulfoxide (DMSO), and methanol were purchased from Merck (Darmstadt, Germany). LC grade formic acid (FA), 17β-estradiol (E2), 17α-ethinyl-17β-estradiol (EE2), 2’-deoxyguanosine (dG), 2’-deoxyadenosine (dA) were purchased from Thermo Fisher Scientific Inc (Walthan, MA, USA).
Cell culture and chromatin isolation
MCF-7 cells (obtained from the Bioresource Collection and Research Center (Hsinchu, Taiwan) were cultured in 15 cm dishes supplemented with DMEM and 10% FBS. The cells were maintained in a humidified incubator at 37 °C and 5% CO2. When cells reached 80% confluence (1 × 10⁷ cells), cells were harvested and crosslinked with 1% formaldehyde. The reaction was quenched in 125 mM glycine. Cells were then re-suspended in 800 μL cytosol extraction buffer (10 mM HEPES, 10 mM KCl, 1.5 mM DTT, 1% Triton X-100, 1x protease inhibitor, 5% glycerol) and incubated on ice for 15 min to permeabilize the cells. The pellets were subsequently digested with 4000 gel units of MNase for 1 h at 37 °C in 100 μL of digestion buffer (50 mM Tris-HCl [pH 7.9], 5 mM CaCl2, 100 μl/mL bovine serum albumin) and arrested with 5 mM EDTA. The chromatin was harvested from the resulting supernatant by centrifugation at 16,000 × g for 10 min and was determined to contain 500 μg total protein (determined by BCA assay) and 100 μg total DNA (measured by Thermo Scientific µdrop plate).
In-situ generation of CE quinone and adduct formation
4OHEE2 quinone was generated in-situ for adduct formation following the procedure described by Muhammad Zahid et al.10. Briefly, a volume of 10 μL of 4OHEE2 solution (~1.3 mM in ACN/DMSO 80:20 v/v solvent) was added with manganese dioxide (1 mg) and then incubated at −30 °C for 30 min. The resulting yellowish quinone solution was filtered through a hydrophilic 0.45 µm PTFE membrane (Merck Millipore, France) to remove manganese dioxide, quickly evaporated (~2 min) under a nitrogen flow to remove ACN, and then immediately added to the nucleosides (dA or dG), calf thymus DNA, or purified chromatin solution to form adducts.
4OHEE2-A/G and 4OHEE2-dA/dG adduct standards were prepared by immediately adding 2.0 μL of the in-situ generated quinone solution to 5.5 μL of of dG or dA solution (2.0 μg/μL in 50% acetic acid) and incubated at 37 °C for 5 h to result in a mixture of released 4OHEE2-G/A and stable 4OHEE2-dA/dG adducts detected by MS1 and MS2 full scan. The concentrations of each adduct standards were determined based on the calibration curve of 4OHE1-G assuming a similar ionization efficiency. The standard mixtures were stored in −80 °C and used immediately after thawing. All adducts were confirmed to be stable under such storage condition.
To form adducts from calf thymus DNA, 23.4 μL of the in-situ generated quinone was added with calf thymus DNA (100 μg) in PBS buffer (500 μL final volume) and incubated at 37 °C for 24 h. This yielded adducts generated from 300 μM 4OHEE2. A control was prepared by adding 23.4 μL DMSO with calf thymus DNA (100 μg) in PBS buffer and incubated side-by-side. The DNA was precipitated using 2 volumes of ACN containing 20 mM NaCl. The supernatant, containing released adducts, was dried, re-suspended in 25 μL of H2O/ACN (80:20 v/v), and stored at −20 °C until use. The pellet was dissolved in PBS buffer and hydrolyzed for LC-MS2 analysis as described in later.
To form adducts from purified chromatin, 2.4 or 23.4 μL of the in-situ generated quinone was added with the isolated chromatin (containing 100 μg DNA) in PBS buffer (500 μL final volume) and incubated at 37 °C for periods ranging from 0 to 24 h. This yielded adducts generated from 30 or 300 μM 4OHEE2, respectively, at different times. A control was prepared by adding 2.4 or 23.4 μL DMSO with the isolated chromatin (100 μg DNA) in PBS buffer and incubated side-by-side. Proteins and DNA were precipitated using 2 volumes of ACN containing 20 mM NaCl. The supernatant, containing released adducts, were dried, re-suspended in 25 μL of H2O/ACN (80:20), and stored at −20 °C until use. The pellet was dissolved in PBS buffer, followed by digestion with 2 μL of Proteinase K (10 mg/mL) at 65 °C for 18 h. DNA was purified using phenol:chloroform:isoamyl alcohol (25:24:1) extraction. The DNA in the aqueous phase was washed with chloroform, precipitated with ice-cooled isopropanol, washed with ice-cooled 75% ethanol, and dried. The purified chromatin DNA containing stable adducts were hydrolyzed for LC-MS2 analysis or for Click-Probe-Seq as described later.
To form adducts by cell incubation, 4OHE2 was directly used for incubation without quinone generation. A total of four cell plates were starved for 24 h in serum-free medium, followed by treatment with either DMSO (control) or 4OHE2 (30 μM) at 37 °C for 24 h. After incubation, the cells were collected, washed three times with PBS, and crosslinked with 1% formaldehyde. The cells were then processed for chromatin isolation as described in the chromatin isolation section. The total DNA collected from the treated cells was subsequently hydrolyzed for LC-MS2 analysis as described later.
DNA hydrolysis
Before LC-MS2 analysis, the purified chromatin DNA or calf thymus DNA was hydrolyzed into nucleosides using a tetra-enzyme mixture following previously reported method with some modifications51. Briefly, DNA (100 μg) dissolved in 100 μL of 5.00 mM BIS-TRIS buffer (pH 7.0) was boiled for 30 min. Then, 3 μL of the tetra-enzyme mixture consisting of 10.0 μL of DNase I (20,000 U/mL), 15.0 μL of NP1 (200 U/mL), 40.0 μL of PDE I (100 U/mL), and 0.50 μL of ALP (40,000 U/mL), was added. The digestion was performed at 37 °C for 18 h. The stable 4OHEE2 adducts were enriched by ACN salting-out extraction52, dried, resuspended in H2O/ACN (80:20) and stored at −20 °C until use.
Capillary-flow LC-MRM and data analysis
The adduct standards, collected supernatant, or pellet hydrolysate sample (5 μL) was loaded into a trap capillary (5 mm × 0.2 mm) packed with C18 reversed phase (5 μm, VYDAC, Hesperia) and then injected into a separation capillary column (220 mm × 0.2 mm) packed with C18 reversed phase (1.7 μm, BEH, Waters, Milford) using nano-UPLC system (ACQUITY UPLC, Waters, Corporation, Milford, MA, USA) which is on-line coupled to MS (4000QTRAP, MDS Sciex, Toronto, Canada) via nano-ESI interface. Mobile phase A containing 0.1% formic acid in water, and mobile phase B containing 0.1% formic acid in ACN, were used for separation. A volume of 5 μL of the sample was loaded onto the trap column at a flow rate of 10 μL/min at 10% B for 2 min. This was followed by a 20-min separation gradient starting from 10% B for 2 min, escalating from 10% to 70% B within a minute, then with a linear gradient from 10 to 70% B over 10 min, and held at 70% for 2 min, and finally, reduced to 10% B in 2 min and holding for another 3 min at a flow rate of 1.7 μL/min. The system was allowed to equilibrate for 10 min between injections. The MRM transition parameters listed in below were set up based on MS1 and MS2 full scan of each prepared adduct standards. All data were acquired under positive mode with capillary voltage at 4 kV, nitrogen gas used as cone gas, and collision gas at an interface temperature of 150 °C.
MRM parameters
| Compound | Precursor [M-H]+ (Da) | Product ion (Da) | Collision energy (V) | DP (V) | EP (V) | CXP (V) |
|---|---|---|---|---|---|---|
| 4OHE1-G | 436 | 152 | 62 | 188 | 9 | 24 |
| 4OHEE2-A | 446 | 136 | 62 | 188 | 9 | 24 |
| 4OHEE2-G | 462 | 152 | 62 | 188 | 9 | 24 |
| 4OHEE2-dG | 578 | 462 | 23 | 135 | 7 | 18 |
| 4OHEE2-dA | 562 | 446 | 23 | 135 | 7 | 18 |
The peak area of each transition (precursor/product ion pair) of MRM detection was used for quantification. The limit of detection (LOD) (signal-to-nose ratio = 2-3) and the limit of quantification (LOQ) (signal-to-nose ratio = 8-10) were determined to be <0.5 ng/mL and <1 ng/mL, respectively. Calibration curves were constructed by 6 serial dilutions of adducted standards using peak area subtracted by the area of the solvent blank. The method was validated by two QC samples with low (5 ppb) and high (25 or 50 ppb) concentration for each standard prepared from the stock solution.
Click-Probe-Seq
The chromatin DNA was determined to have 100 µg. Isolated DNA was then re-suspended in de-ionized water and added with reagents at final concentrations of 0.2 mM CR3 linker, 0.2 mM CuSO4, 1 mM THPTA, and 2 mM L-sodium ascorbate in a total volume of 120 μL. The mixture was thoroughly mixed and incubated at 37 °C for 1 h to facilitate the reaction. Following incubation, the DNA was precipitated with isopropanol and re-dissolved in PBS buffer. Next, 20 μL of streptavidin beads was added to pull down the clicked stable DNA adducts. The mixture was incubated for 2 h, after which the supernatant was removed by centrifugation. The pellet were then cleaned up successively with 2 mL of 40% ACN, 4 mL of 1% SDS buffer, and 3 mL of PBS buffer. The pulldown DNA was then cleaved from the beads by adding DTT to a final concentration of 1 M and the reaction was performed at 50 °C to completely reduce the disulfide linker. The supernatant, containing the enriched stable DNA adducts, was collected and purified with isopropanol precipitation. Subsequently, One-third of the purified DNA adducts were loaded onto a 1.5% agarose gel. A 100 bp DNA ladder (ExcelBandTM, Smobio) was also loaded as reference. The gel was then submerged in a safe green staining solution (Novel green plus, GeneDireX) and visualized under a Blue-LED transiluminator BlookTM (GeneDireX). Once the presence of enriched stable DNA in the sample was confirmed, the experiment was replicated three times, and the samples were pooled together for NGS analysis.
NGS and DHS correlation
The pooled pulldown DNA (~10 ng determined by Agilent TapeStation4200) samples were submitted to Welgene Co. (Taiwan) for NGS conducted on Illumina NovaSeq (151 cycles paired-end reads). The NGS library was constructed with an SSEL XT Low Input Reagent Kit with IDT for Illumina – TruSeq DNA UD Indexes following the manufacturer’s protocol by Welgene Co. core facility. The sequencing experiments were conducted once for Human genome. Raw FASTQ reads were quality and adaptor trimmed by fastp 0.20.0. Trimmed reads were mapped to the human reference genome GRCh38 by bowtie2 2.3.4.3. The control reads provided background information for deducing the folds of peak enrichment by MACS 2.2.4 with minimum FDR (q-value) cutoff value set to 0.05. The distribution of genomic elements (Promoter, 5’-UTR, 3’-UTR, Exon, Downstream, Intron, Distal Intergenic) and the percentage of GC (GC%) in the reference genome and enriched peaks (>1.36 folds, q < 0.05) were analyzed in R 3.5.1. All the enriched peak sequences were mapped to the full ERE sequence (GGTCAnnnTGACC) and/or each of the two half ERE sequences (GGTCA or TGACC) to find out the matched numbers.
The clustered DNase hypersensitive site (DHS) map2 identified from un-treated MCF-7 cell was downloaded from UCSC Table Browser. The log2 (average folds of peak enrichment in 100 kb bins) values were correlated to the log2 (coverage of DHS in 100 kb bins) values across genome. The correlation heat map across the whole genome and mirror images of selected chromosomes were displayed using graphic functions of EXCEL.
Cell Viability
For MTT assay, MCF-7 Cells were seeded at a density of 15,000 cells/well in 96-well plates. Cells were allowed to adhere overnight prior to the starvation process with serum free for 24 h, followed by the treatment of ACN/ E2/4OHE2/4OHEE2 at 30 μM for 24 h. Next, the MTT stock solution was diluted in serum-free media to a final concentration of 0.5 mg/mL. Then, 100 μL of MTT stock solution was added to each well and allowed to incubate for another 3 h at 37 °C with 5% CO2. The supernatants were carefully removed, and 100 μL of DMSO was added to each well to dissolve the precipitate. The plate was vigorously shaken for 5 min at room temperature. The UV absorbance at 570 and 690 nm (reference wavelength) was measured using a SpectraMax M2e multimode microplate reader (Molecular Devices Inc.). The cell viability (% percentage) of the control (DMSO) and 24 h treatment was respectively calculated based on the optical density ratio between the cells treated with E2/4OHE2/4OHEE2 and vehicle control. The results were calculated statistically using Microsoft Office Excel.
Immunofluorescence staining
A total of 1 ×10⁴ cells/well MCF-7 was grown on glass slides for 24 h, after which cells were fixed with 4% paraformaldehyde (Sigma-Aldrich; Merck KGaA) at 4 °C for 10 min. The fixed cells were permeabilized with 0.5% Triton X-100, washed with 0.1% triton X-100prior, blocking with 5% horse serum and incubated overnight at 4 °C with a mouse anti-gamma H2AX antibody (ab36250, Abcam Cambridge Science Park, Cambridge, UK) diluted 1:1000 in blocking buffer. Cells were washed three times with PBS for 5 min and incubated with biotin conjugated secondary antibody diluted 1:500 for 1 h. Cells were then washed three times for 10 min with PBS and incubated fluorescence-streptavidin conjugates (CY3) for 1 h. Cells nuclei were stained with DAPI (Sigma-Aldrich). Finally, coverslips were inverted and mounted onto a microscope slide with 90% glycerol in PBS. Three independent experiments were imaged with magnification ×40, and resulting images were analyzed using imageJ. A minimum of 40 cells per treatment condition were imaged, and cells with > 2 γH2AX foci were quantified and divided by total number of cells as determined by DAPI counterstain.
RT-PCR
Total RNA was extracted from treated MCF-7 cells using TRIzol RNA Isolation Reagents. For each extraction, approximately 1 ×10⁶ cells were lysed and homogenized in 1 mL of TRI- reagent, followed by adding 0.2 mL chloroform and shaked until homogenized. The sample were incubated for 5 min, prior to centrifugation at 12,000 rpm for 15 min at 4 °C. The aqueous phase was transferred to a new eppendoft, and 0.6 mL of isopropanol was added and mixed gently by inverting the eppendoft several times. The samples were then centrifuged at 12,000 rpm for 10 min at 4 °C and the supernatant was discarded. The RNA pellets were washed with 75% (v/v) ethanol and centrifuged at 12,000 rpm for 10 min. The supernatant was removed and the RNA was air dried and resuspended in 20 µL RNase-free water. Samples were stored at –30 °C. 4 µg RNA (measured by Thermo Scientific µdrop plate) was reversely transcribed into complementary DNA using Deoxy + HiSpec Reverse Transcriptase kit (Yeastern Biotech Co., Ltd., Taipei, Taiwan) according to the manufacturer’s protocol. The cDNA synthesized was diluted 10 times. 8uL cDNA was amplified by adding go taqTM Master Mixes (Promega), reverse primer, and forward primer of GADPH, GREB1, BRCA1, KIF-23, RAD51C, MYC, NCOA3 with a total volume of 20 µL. The PCR conditions consisted of one cycle of 94 °C for 3.5 min, 25 cycles at 94 °C for 20 s, 60 °C for 30 s, and 72 °C for 30 s. The loading control was GAPDH and the primers were as follows:
GADPH Forward: 5’-GTCTCCTCTGACTTCAACAGCG-3’
GADPH Reverse: 5’-ACCACCCTGTTGCTGTAGCCAA-3’
GREB1 Forward: 5’-GGTCTGCCTTGCATCCTGATCT-3’
GREB1 Reverse: 5’-TCCTGCTCCAAGGCTGTTCTCA-3’
BRCA1 Forward: 5’-CTGAAGACTGCTCAGGGCTATC-3’
BRCA1 Reverse: 5’- AGG GTA GCT GTT AGA AGG CTG G -3’
RAD51C Forward: 5’-GTGAAACCCTCCGAGCTTAGCA-3’
RAD51C Reverse: 5’-CCTGCTCAAGAAGTTCCAGTGC-3’
KIF-23 Forward: 5’-GTAGCAAGACCTGTAGACAAGGC-3’
KIF23 Reverse: 5’-TTCGCATGACGGCAAAGGTGGA-3’
MYC Forward: 5’-CCTGGTGCTCCATGAGGAGAC-3’
MYC Reverse: 5’-CAGACTCTGACCTTTTGCCAGG-3’
NCOA3 Forward: 5’- GGACTAAGCAACAGGTGTTTCAAG-3’
NCOA3 Reverse: 5’- ACTGGAGGACTTGAGCCAACAG-3’
Statistics and reproducibility
No data exclusion was performed in the data analysis. All experiments were performed with three biological replicates. Student’s t test was used to calculated p-values.
Reporting summary
Further information on research design is available in the Nature Portfolio Reporting Summary linked to this article.
Supplementary information
Description of Additional Supplementary Files
Acknowledgements
This work is supported by National Science and Technology Council (NSTC), Taiwan, Republic of China (111-2113-M-00600130MY3).
Author contributions
All authors confirm contribution to the paper as follows: study conception and supervision: S.H.C.; study design: S.H.C., Q.T.D., S.F.T.; data collection: Q.T.D. and H.K. (preliminary MS data); data analysis: S.H.C., Q.T.D., S.F.T.; data interpretation: S.H.C., Q.T.D., S.F.T., C.Y.W., C.H.W.; draft manuscript preparation: S.H.C., Q.T.D. All authors reviewed the results and approved the final version of the manuscript.
Peer review
Peer review information
Communications Biology thanks Eleanor Rogan, Yuxiang Cui, and the other, anonymous, reviewer for their contribution to the peer review of this work. Primary Handling Editors: Joanna Timmins and Mengtan Xing. A peer review file is available.
Data availability
All raw and processed sequencing data from Click-Probe-Seq has been deposited in NCBI Gene expression Omnibus (GEO; https://www.ncbi.nlm.nih.gov/geo/) under accession GSE279116. Source data of main figures/graphs are shown in the Supplementary Data 2. The original uncropped and unedited gels are included in the Supplementary Information.
Competing interests
The authors declare no completing interests.
Footnotes
Publisher’s note Springer Nature remains neutral with regard to jurisdictional claims in published maps and institutional affiliations.
Supplementary information
The online version contains supplementary material available at 10.1038/s42003-025-07657-0.
References
- 1.Burgos-Barragan, G. et al. Mammals divert endogenous genotoxic formaldehyde into one-carbon metabolism. Nature548, 549–554 (2017). [DOI] [PMC free article] [PubMed] [Google Scholar]
- 2.Garaycoechea, J. I. et al. Genotoxic consequences of endogenous aldehydes on mouse haematopoietic stem cell function. Nature489, 571–575 (2012). [DOI] [PubMed] [Google Scholar]
- 3.Cavalieri, E. L. & Rogan, E. G. A Unifying Mechanism in the Initiation of Cancer and Other Diseases by Catechol Quinones. Ann. N. Y. Acad. Sci.1028, 247–257 (2004). [DOI] [PubMed] [Google Scholar]
- 4.Lutz, W. K. Endogenous genotoxic agents and processes as a basis of spontaneous carcinogenesis. Mutat. Res. Rev. Genet. Toxicol.238, 287–295 (1990). [DOI] [PubMed] [Google Scholar]
- 5.De Bont, R. & van Larebeke, N. Endogenous DNA damage in humans: a review of quantitative data. Mutagenesis19, 169–185 (2004). [DOI] [PubMed] [Google Scholar]
- 6.Rüdiger, H. W. Endogenous carcinogens: implications of an emerging concept. Mutat. Res. Rev. Genet. Toxicol.238, 173–174 (1990). [Google Scholar]
- 7.Soloway, A. H. & Lequesne, P. W. Potential endogenous mutagens/carcinogens. J. Theor. Biol.85, 153–163 (1980). [DOI] [PubMed] [Google Scholar]
- 8.Liehr, J. G. et al. 4-Hydroxylation of estradiol by human uterine myometrium and myoma microsomes: implications for the mechanism of uterine tumorigenesis. Proc. Nat. Acad. Sci.92, 9220–9224 (1995). [DOI] [PMC free article] [PubMed] [Google Scholar]
- 9.Stack, D. E., Byun, J., Gross, M. L., Rogan, E. G. & Cavalieri, E. L. Molecular Characteristics of Catechol Estrogen Quinones in Reactions with Deoxyribonucleosides. Chem. Res. Toxicol.9, 851–859 (1996). [DOI] [PubMed] [Google Scholar]
- 10.Zahid, M., Kohli, E., Saeed, M., Rogan, E. & Cavalieri, E. The Greater Reactivity of Estradiol-3,4-quinone vs Estradiol-2,3-quinone with DNA in the Formation of Depurinating Adducts: Implications for Tumor-Initiating Activity. Chem. Res. Toxicol.19, 164–172 (2006). [DOI] [PubMed] [Google Scholar]
- 11.Cavalieri, E. L. & Rogan, E. G. Depurinating estrogen-DNA adducts, generators of cancer initiation: their minimization leads to cancer prevention. Clin. Transl. Med.5, e12 (2016). [DOI] [PMC free article] [PubMed] [Google Scholar]
- 12.Chakravarti, D. et al. Evidence that a burst of DNA depurination in SENCAR mouse skin induces error-prone repair and forms mutations in the H-ras gene. Oncogene20, 7945–7953 (2001). [DOI] [PubMed] [Google Scholar]
- 13.Embrechts, J. et al. Detection of estrogen DNA-adducts in human breast tumor tissue and healthy tissue by combined nano LC-nano ES tandem mass spectrometry. J. Am. Soc. Mass Spectrom.14, 482–491 (2003). [DOI] [PubMed] [Google Scholar]
- 14.Spink, D. C. et al. The effects of 2,3,7,8-Tetrachlorodibenzo-p-dioxin on estrogen metabolism in MCF-7 breast cancer cells: Evidence for induction of a novel 17β-estradiol 4-hydroxylase. J. Steroid Biochem. Mol. Biol.51, 251–258 (1994). [DOI] [PubMed] [Google Scholar]
- 15.Bolton, J. L. & Thatcher, G. R. J. Potential Mechanisms of Estrogen Quinone Carcinogenesis. Chem. Res. Toxicol.21, 93–101 (2008). [DOI] [PMC free article] [PubMed] [Google Scholar]
- 16.Li, J. J. & Li, S. A. Estrogen Carcinogenesis in Hamster Tissues: A Critical Review. Endocr. Rev.11, 524–531 (1990). [DOI] [PubMed] [Google Scholar]
- 17.Nandi, S., Guzman, R. C. & Yang, J. Hormones and mammary carcinogenesis in mice, rats, and humans: a unifying hypothesis. Proc. Nat. Acad. Sci.92, 3650–3657 (1995). [DOI] [PMC free article] [PubMed] [Google Scholar]
- 18.Chang, M. et al. Activation of Estrogen Receptor-Mediated Gene Transcription by the Equine Estrogen Metabolite, 4-Methoxyequilenin, in Human Breast Cancer Cells. Endocrinology148, 4793–4802 (2007). [DOI] [PubMed] [Google Scholar]
- 19.Nik-Zainal, S. et al. The genome as a record of environmental exposure. Mutagenesis30, 763–770 (2015). [DOI] [PMC free article] [PubMed] [Google Scholar]
- 20.Hu, J., Adar, S., Selby, C. P., Lieb, J. D. & Sancar, A. Genome-wide analysis of human global and transcription-coupled excision repair of UV damage at single-nucleotide resolution. Genes Dev.29, 948–960 (2015). [DOI] [PMC free article] [PubMed] [Google Scholar]
- 21.Jiang, Y. et al. Quantification and Mapping of Alkylation in the Human Genome Reveal Single Nucleotide Resolution Precursors of Mutational Signatures. ACS Cent. Sci.9, 362–372 (2023). [DOI] [PMC free article] [PubMed] [Google Scholar]
- 22.Li, W. et al. Human genome-wide repair map of DNA damage caused by the cigarette smoke carcinogen benzo[a]pyrene. Proc. Nat. Acad. Sci.114, 6752–6757 (2017). [DOI] [PMC free article] [PubMed] [Google Scholar]
- 23.Ding, Y., Fleming, A. M. & Burrows, C. J. Sequencing the Mouse Genome for the Oxidatively Modified Base 8-Oxo-7,8-dihydroguanine by OG-Seq. J. Am. Chem. Soc.139, 2569–2572 (2017). [DOI] [PMC free article] [PubMed] [Google Scholar]
- 24.Anders, L. et al. Genome-wide localization of small molecules. Nat. Biotechnol.32, 92–96 (2014). [DOI] [PMC free article] [PubMed] [Google Scholar]
- 25.Tung, S.-Y., Hong, J.-Y., Walz, T., Moazed, D. & Liou, G.-G. Chromatin affinity-precipitation using a small metabolic molecule: its application to analysis of O-acetyl-ADP-ribose. Cell. Mol. Life Sci.69, 641–650 (2012). [DOI] [PMC free article] [PubMed] [Google Scholar]
- 26.Thirumurugan, P., Matosiuk, D. & Jozwiak, K. Click Chemistry for Drug Development and Diverse Chemical–Biology Applications. Chem. Rev.113, 4905–4979 (2013). [DOI] [PubMed] [Google Scholar]
- 27.Liang, H.-C. et al. In Situ Click Reaction Coupled with Quantitative Proteomics for Identifying Protein Targets of Catechol Estrogens. J. Proteome Res.17, 2590–2599 (2018). [DOI] [PubMed] [Google Scholar]
- 28.Do, Q.-T., Huang, T.-E., Liu, Y.-C., Tai, J.-H. & Chen, S.-H. Identification of Cytosolic Protein Targets of Catechol Estrogens in Breast Cancer Cells Using a Click Chemistry-Based Workflow. J. Proteome Res.20, 624–633 (2021). [DOI] [PubMed] [Google Scholar]
- 29.Tretyakova, N., Villalta, P. W. & Kotapati, S. Mass Spectrometry of Structurally Modified DNA. Chem. Rev.113, 2395–2436 (2013). [DOI] [PMC free article] [PubMed] [Google Scholar]
- 30.Gaikwad, N. W. et al. The molecular etiology of breast cancer: Evidence from biomarkers of risk. Int. J. Cancer122, 1949–1957 (2008). [DOI] [PMC free article] [PubMed] [Google Scholar]
- 31.Huang, Y.-S. et al. Targeting Endogenous Adduction Level of Serum Albumin by Parallel Reaction Monitoring via Standard Additions and Intact Protein Measurement: Biological Dosimetry of Catechol Estrogens. Anal. Chem.91, 15922–15931 (2019). [DOI] [PubMed] [Google Scholar]
- 32.Jen, H.-H. et al. Quantification of the Endogenous Adduction Level on Hemoglobin and Correlation with Albumin Adduction via Proteomics: Multiple Exposure Markers of Catechol Estrogen. J. Proteome Res.20, 4248–4257 (2021). [DOI] [PubMed] [Google Scholar]
- 33.Pruthi, S. et al. Evaluation of serum estrogen-DNA adducts as potential biomarkers for breast cancer risk. J. Steroid Biochem. Mol. Biol.132, 73–79 (2012). [DOI] [PMC free article] [PubMed] [Google Scholar]
- 34.Lin, C.-Y. et al. Whole-Genome Cartography of Estrogen Receptor α Binding Sites. PLoS Genet3, e87 (2007). [DOI] [PMC free article] [PubMed] [Google Scholar]
- 35.Welboren, W. J. et al. ChIP-Seq of ERα and RNA polymerase II defines genes differentially responding to ligands. EMBO J.28, 1418–1428 (2009). [DOI] [PMC free article] [PubMed] [Google Scholar]
- 36.Stachowicz-Kuśnierz, A. & Korchowiec, J. Nucleophilic properties of purine bases: inherent reactivity versus reaction conditions. Struct. Chem.27, 543–555 (2016). [Google Scholar]
- 37.Cavalieri, E. et al. Mechanism of DNA depurination by carcinogens in relation to cancer initiation. IUBMB Life64, 169–179 (2012). [DOI] [PMC free article] [PubMed] [Google Scholar]
- 38.Saeed, M., Zahid, M., Gunselman, S. J., Rogan, E. & Cavalieri, E. Slow loss of deoxyribose from the N7deoxyguanosine adducts of estradiol-3,4-quinone and hexestrol-3′,4′-quinone.: Implications for mutagenic activity. Steroids70, 29–35 (2005). [DOI] [PubMed] [Google Scholar]
- 39.Miyajima, T. et al. Loss of NQO1 generates genotoxic estrogen-DNA adducts in Fuchs Endothelial Corneal Dystrophy. Free Radic. Biol. Med.147, 69–79 (2020). [DOI] [PMC free article] [PubMed] [Google Scholar]
- 40.Thurman, R. E. et al. The accessible chromatin landscape of the human genome. Nature489, 75–82 (2012). [DOI] [PMC free article] [PubMed] [Google Scholar]
- 41.Klinge, C. M. Estrogen receptor interaction with estrogen response elements. Nucleic Acids Res29, 2905–2919 (2001). [DOI] [PMC free article] [PubMed] [Google Scholar]
- 42.Barnea, E. R., MacLusky, N. J. & Naftolin, F. Kinetics of catechol estrogen-estrogen receptor dissociation: A possible factor underlying differences in catechol estrogen biological activity. Steroids41, 643–656 (1983). [DOI] [PubMed] [Google Scholar]
- 43.Stork, C. T. et al. Co-transcriptional R-loops are the main cause of estrogen-induced DNA damage. eLife5, e17548 (2016). [DOI] [PMC free article] [PubMed] [Google Scholar]
- 44.Crossley, M. P., Bocek, M. & Cimprich, K. A. R-Loops as Cellular Regulators and Genomic Threats. Mol. Cell73, 398–411 (2019). [DOI] [PMC free article] [PubMed] [Google Scholar]
- 45.Li, X. & Heyer, W.-D. Homologous recombination in DNA repair and DNA damage tolerance. Cell Res18, 99–113 (2008). [DOI] [PMC free article] [PubMed] [Google Scholar]
- 46.Williamson, L. M. & Lees-Miller, S. P. Estrogen receptor α-mediated transcription induces cell cycle-dependent DNA double-strand breaks. Carcinogenesis32, 279–285 (2010). [DOI] [PubMed] [Google Scholar]
- 47.Spillman, M. A. & Bowcock, A. M. BRCA1 and BRCA2 mRNA levels are coordinately elevated in human breast cancer cells in response to estrogen. Oncogene13, 1639–1645 (1996). [PubMed] [Google Scholar]
- 48.Savage, K. I. et al. BRCA1 Deficiency Exacerbates Estrogen-Induced DNA Damage and Genomic Instability. Cancer Res.74, 2773–2784 (2014). [DOI] [PMC free article] [PubMed] [Google Scholar]
- 49.Alayev, A. et al. Estrogen induces RAD51C expression and localization to sites of DNA damage. Cell Cycle15, 3230–3239 (2016). [DOI] [PMC free article] [PubMed] [Google Scholar]
- 50.Jensen, E. V. & Jordan, V. C. The Estrogen Receptor: A Model for Molecular Medicine1. Clin. Cancer Res.9, 1980–1989 (2003). [PubMed] [Google Scholar]
- 51.Li, L. Development of quantitative LC-MS/MS methods for the pharmacological studies of anti-cancer drugs. Electronic Thesis or Dissertation, 53–67 (Cleveland State University, 2011).
- 52.Kafeenah, H. et al. Label-free and de-conjugation-free workflow to simultaneously quantify trace amount of free/conjugated and protein-bound estrogen metabolites in human serum. Anal. Chim. Acta1232, 340457 (2022). [DOI] [PubMed] [Google Scholar]
Associated Data
This section collects any data citations, data availability statements, or supplementary materials included in this article.
Supplementary Materials
Description of Additional Supplementary Files
Data Availability Statement
All raw and processed sequencing data from Click-Probe-Seq has been deposited in NCBI Gene expression Omnibus (GEO; https://www.ncbi.nlm.nih.gov/geo/) under accession GSE279116. Source data of main figures/graphs are shown in the Supplementary Data 2. The original uncropped and unedited gels are included in the Supplementary Information.