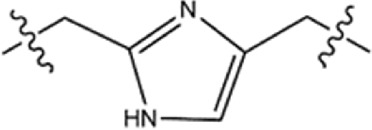
TABLE 1.
Structure−activity relationships (SARs) of BSTs 1–5.

| |||
|---|---|---|---|
| Compounds | Linker | BRD4 (IC50, nM) | STAT3 (IC50, nM) |
| BST-1 |

|
15.73 ± 1.31 | 20.82 ± 1.94 |
| BST-2 |

|
4.64 ± 0.17 | 27.16 ± 2.82 |
| BST-3 |

|
7.09 ± 0.53 | 11.33 ± 0.95 |
| BST-4 |

|
2.45 ± 0.11 | 8.07 ± 0.51 |
| BST-5 |

|
10.12 ± 1.15 | 17.83 ± 1.24 |
| RVX-208 | — | 39.86 ± 3.72 | no inhibition |
| CJ-1383 | — | no inhibition | 936 ± 14.87 |
