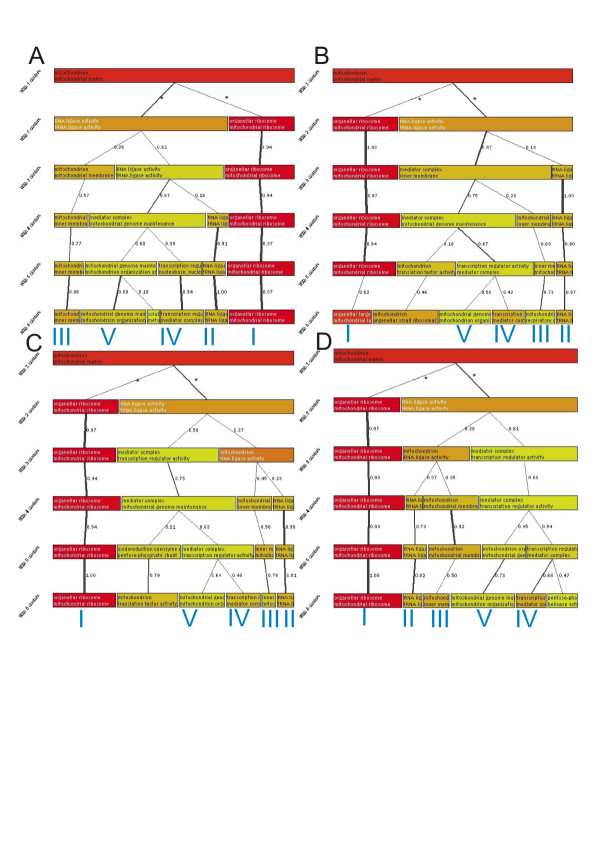
Figure 2.
Replications of non-nested hierarchical clustering tree with H2O2 dataset. The figure presents the four replications for the non-nested hierarchical clustering graph for H2O2 dataset. We have marked the conserved gene clusters with the same Roman numerals as in figure 1. Notice that most clusters (especially I, II and III) can be observed over several levels in each cluster tree.

