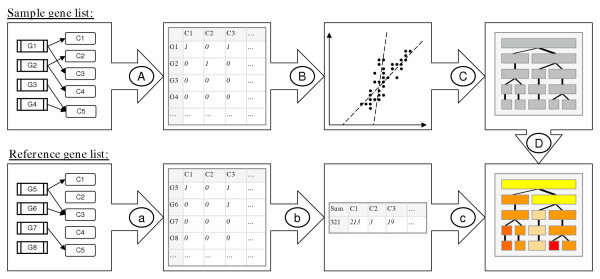
Figure 4.
Flow diagram of the method. The gene associations with the GO functional classes in the sample and reference gene lists are transformed into binary matrices (A and a) and a sum vector (b). The sample set is clustered with NMF based method (B) into a varying number of sub-groups producing a non-nested hierarchical tree (C). Contents of the clusters are described with the over-represented classes within them (c and D).

