
Figure 2.
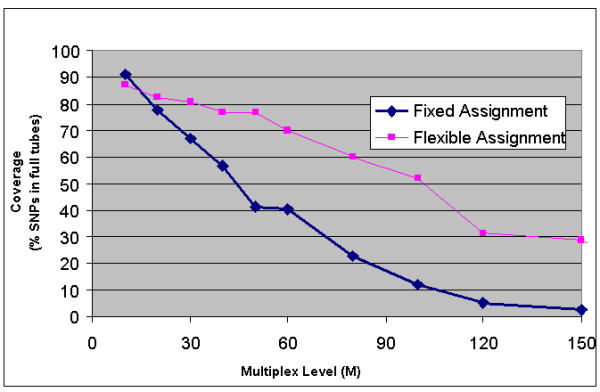
Coverage vs. target multiplex level using two different best-fit tube assignment strategies. These results were all based on N = 1,200 for varying target multiplexing level M. In each trial, the number of allowed tubes is limited to  . Full-tube coverage, the percentage of SNPs assigned to full tubes, of close to 80% is achieved at a multiplexing level of 20, though it drops rapidly for higher multiplexing levels. The graph shows a significant improvement in one algorithm over the other, demonstrating that such tradeoffs can be used to effectively compare and contrast competing optimization strategies.