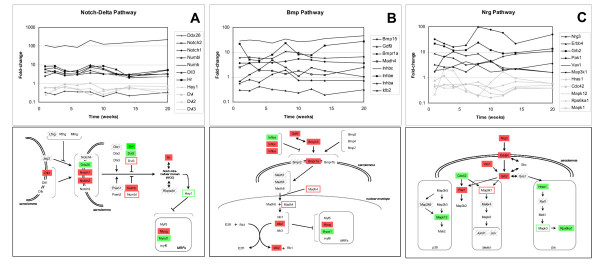
Figure 4.
Reconstruction of active regeneration pathways. Regeneration-associated pathways were constructed based on differentially expressed genes, literature study and gene ontology. Expression levels of genes in the Notch-Delta pathway (Panel A), the Bmp15 pathway (Panel B), and the Neuregulin3 pathway (Panel C) are plotted as fold-changes between mdx and control mice, as a function of age. In the pathway diagrams, filled boxes refer to upregulation (red) and downregulation (green) at 8 weeks. Outlined boxes refer to upregulation (red) and downregulation (green) at other timepoints than 8 weeks. Shaded grey boxes represent genes which are not detected, or are not represented on the microarray. White boxes represent genes that show no differential expression between mdx and control mice.

