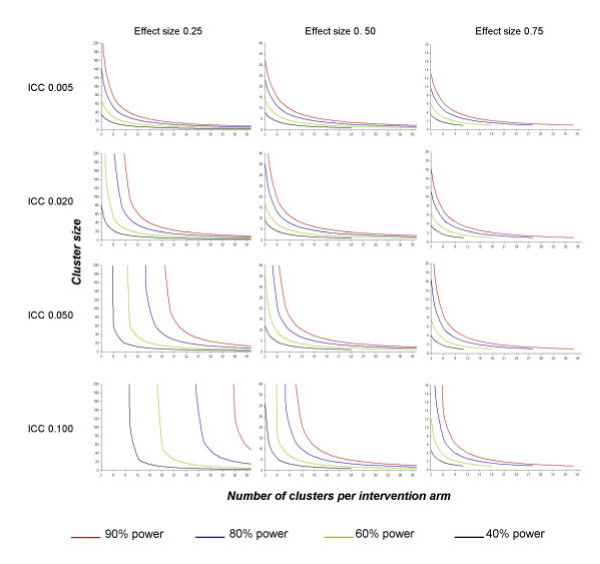
Figure 2.
Power contour graphs for several intraclass correlation coefficients (ICCs) and effect sizes*. Effect size is presented in columns and ICC in rows. In situations above or to the right of the red curve, the statistical power is greater than 90%. In situations between the red and blue curves, the statistical power is between 80% and 90%. In situations between the blue and red curves, the statistical power is between 60% and 80%. For vertical curves, increasing the cluster size is pointless. The number of subjects required, assuming individual randomization, is 24 to achieve a power of 40% to detect an effect size of 0.50, and 38, 28, 18 and 11 to achieve powers of 90%, 80%, 60% and 40%, respectively, to detect an effect size of 0.75, thus, the reason why curves are truncated. *Effect size = absolute difference between the two intervention-specific means divided by the S.D. of the response variable.

