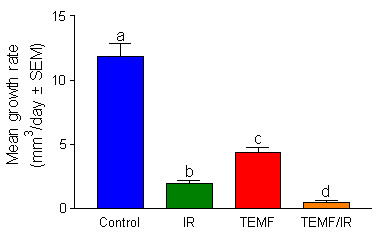
Figure 3.

Mean ± SEM tumor growth rate data from day 7 to day 15 post IR therapy in each treatment group. ANOVA was used to determine any statistical differences in growth rates between treatment groups. Different letters demonstrate significant differences. Tumors in the untreated control group grew significantly faster than did tumors in the other three groups. Tumors in the IR/TEMF group had a growth rate significantly lower than that of the other three groups.
